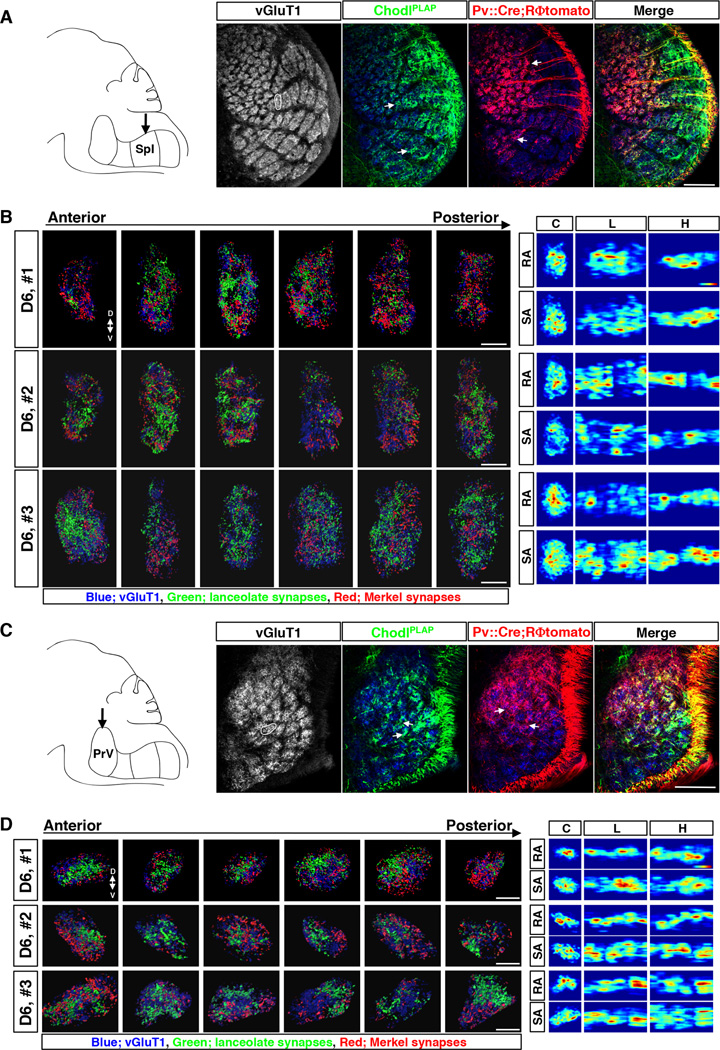
Fig. 2. Axonal projections and presynaptic termini distribution maps of RA-longitudinal lanceolate and SA-Merkel ending neurons within individual barrelette columns in SpI and PrV nuclei.
(A, C) Left panel: Schematic drawing of the brainstem trigeminal complex (sagittal view) with arrow indicating the SpI (A) or PrV (C) nucleus. Right 4 panels: Representative images of immunostaining of vGluT1 (grey or blue), PLAP (green) and tomato (red) on the sections of SpI (A) or PrV (C) nucleus from Pv::Cre; RΦtomato; ChodlPLAP mice (P7). White circle indicates the D6 barrelette. White arrows indicate examples of dense patches of afferent termini. All images are of coronal view.
(B, D) Maps of afferent presynaptic termini inside D6 barrelette in SpI (B) or PrV (D) nucleus from 3 different samples (numbered 1–3). Left panels show representative results of presynaptic sites extracted from confocal images of individual serial sections through each D6 barrelette in Spl (B) or PrV (D). Blue: vGluT1+ loci. Green: presynaptic termini of RA afferents (PLAP+ ∩ vGluT1+). Red: presynaptic termini of SA afferents ((tomato+ ∩ vGluT1+) − (PLAP+ ∩ vGluT1+)). Right panels show the heatmaps of RA- and SA- synaptic densities in each sample; 2D projections of the 3D data from each barrelette column onto 3 different planes are shown. C, coronal plane; L, lateral/sagittal plane; H, horizontal plane. The color on heatmaps represents relative synaptic density in each sample. The highest density is shown as red. The lowest density is shown as blue.
Scale bars: 100 µm (A, C), 20 µm (B, D).
See also Figure. S1, S2, S3 and Movie S1, S2.

