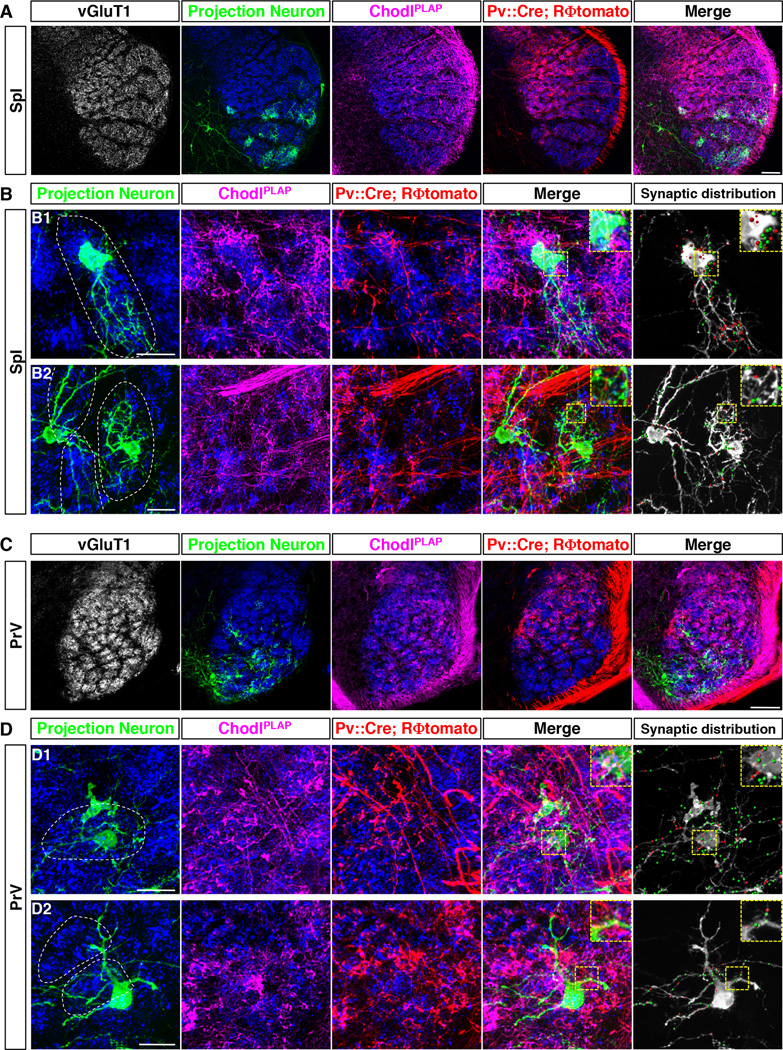
Fig. 4. Convergent RA and SA inputs onto brainstem projection neurons.
(A, C) Representative low magnification images of the 4-color labeling experiments in SpI (A) or PrV (C) nucleus: vGluT1+ synaptic sites (grey or blue, synapses), projection neurons (green), RA-afferents (PLAP, magenta) and SA-afferents (tomato, red), from Pv::Cre; RΦtomato; ChodlPLAP triple transgenic mice (P7) with ΔG-GFP-rabies virus injected into the thalamus.
(B, D) Tow representative high magnification images of the 4-color labeling experiments in SpI (B) or PrV (D) nucleus. White dash lines encircle the barrelette structure. Rightmost panels show synaptic terminals of SA-Merkel and RA-lanceolate-ending neurons onto the labeled projection neurons. Red dots: SA- synapses. Green dots: RA- synapses. Insets: zoom of the yellow boxed region.
Scale bars: 100 µm (A, C), 20 µm (B, D).
See also Figure S5 and S6.

