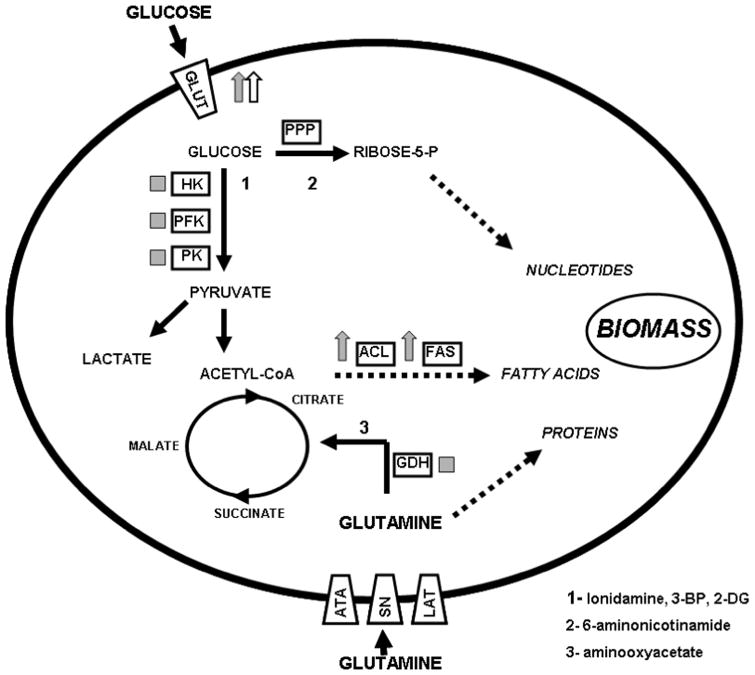
Figure 1. Metabolic perturbations associated with tumorigenesis.
Tumor cell metabolism represents a trade-off between energy and biomass. This is accomplished by diverting glucose from efficient energy generating mechanisms (TCA cycle and oxidative phophorylation) into aerobic glycolysis, and utilizing the resulting acetyl-CoA and citrate molecules into fatty acid generation. Secondary pathways such as the pentose phosphate shunt (PPP) and glutaminolysis are often activated to further augment biomass generation and balance glycolytic losses. Blue arrows indicate over-expression in tumors; blue boxes indicate altered activity in tumors (increased expression, altered localization, epigenetic modification, switches among isozymes); red arrows indicate over-expression in HNSCC cell lines or tumors; red boxes indicate altered activity in HNSCC cell lines or tumors. HK- hexokinase, PFK- phosphofructokinase, PK- pyruvate kinase, ACL- ATP citrate lyase, FAS- fatty acid synthase, GDH- glutamate dehydrogenase, GLUT- glucose transporters, ATA- amino acid transporter A or sodium-coupled neutral amino acid transporter, SN- system N or sodium-coupled neutral amino acid transporter, LAT-system L or sodium independent amino acid transporter.

