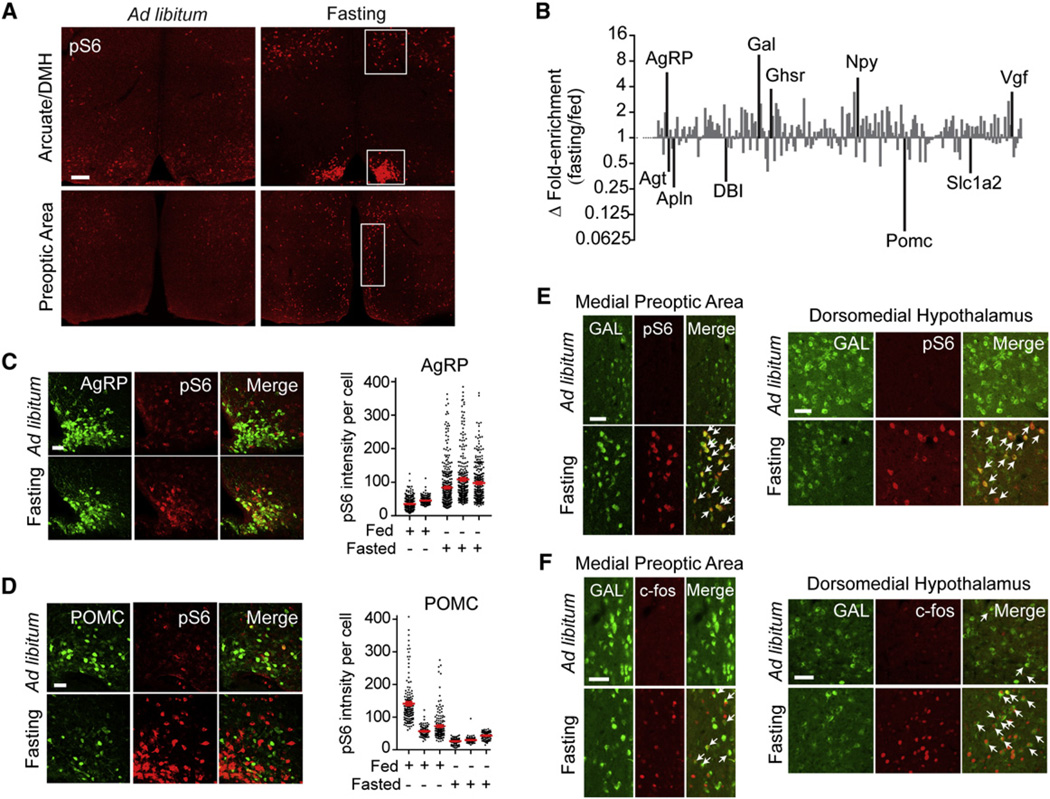
Figure 5. Identification of Neurons Activated by Fasting.
(A) Hypothalamic staining for pS6 244 from fasted and fed mice. Top panels show the arcuate nucleus and DMH, and bottom panels show the preoptic area (highlighted).
(B) Relative enrichment of cell-type-specific genes in pS6 immunoprecipitates from fasted and fed animals. Data are expressed as the ratio of fold enrichment (IP/input) for fasted animals divided by the fold enrichment (IP/input) for fed controls and are plotted on a log scale. Genes with fold enrichment >2.5 and p < 0.05 are labeled.
(C) Left: colocalization between AgRP and pS6 244 in fed and fasted mice. Right: pS6 intensity in AgRP neurons.
(D) Left: colocalization between POMC and pS6 in fed and fasted mice. Right: pS6 intensity in POMC neurons.
(E) Colocalization between Gal and pS6 in fed and fasted mice in the MPA and DMH.
(F) Colocalization between Gal and c-Fos in fed and fasted mice in the MPA and DMH.
All scale bars, 50 mm except (A) (100 mm). All error bars are mean ±SEM. See also Figure S4.

