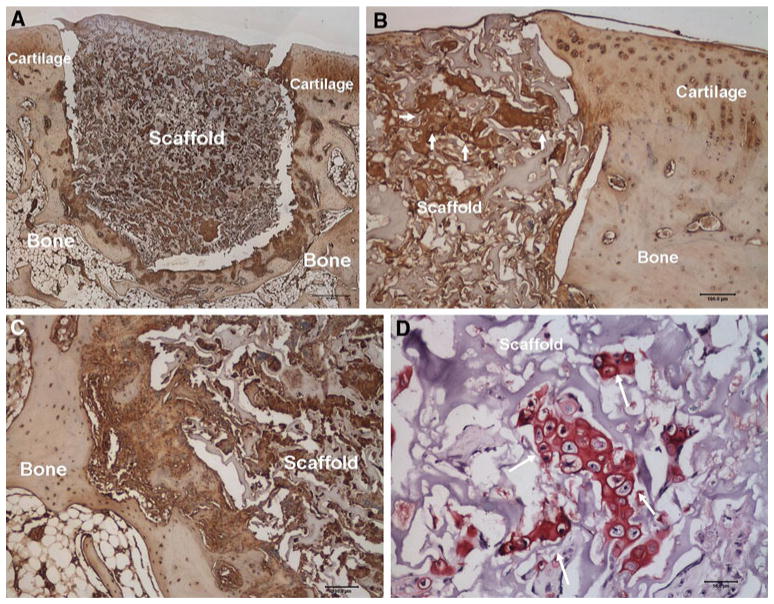
Fig. 2.
a Aggrecan staining at 1 month demonstrates no degeneration of the articular cartilage adjacent to the implant (×1, scale bar represents 500 μm). b Aggrecan staining at 1 month demonstrates good integration of the implant with the adjacent articular cartilage (×10, scale bar represents 100 μm, arrows point to clusters of chondrocyte-like cells producing aggrecan matrix). c Aggrecan staining at 1 month shows partial integration of the implant with adjacent bone, see arrows (×10, scale bar represents 100) within the implant producing proteoglycan (×40, scale bar represents 50 μm). d Safranin-O staining at 1 month demonstrates cells with chondrocyte-like morphology within the implant producing proteoglycan (×40, scale bar represents 50 μm, arrows points to chondrocyte-like cells)

