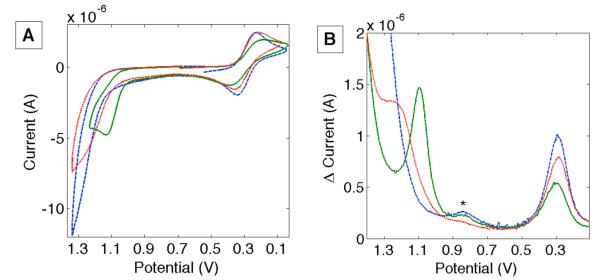
Figure 3.

A) Cyclic voltammogram (20 mV/s) of H124NO2YO−122 azurin (green  ), H107NO2YO−109 (red •••) and all Phe azurin (blue
  ). (B) Differential pulse voltammograms (DPVs) for H124NO2YO−122 azurin (green
  ), H107NO2YO−109 (red •••) and all Phe azurin (blue
  ). The asterisk indicates a background wave. Potentials are versus NHE.
