
FIGURE 4.
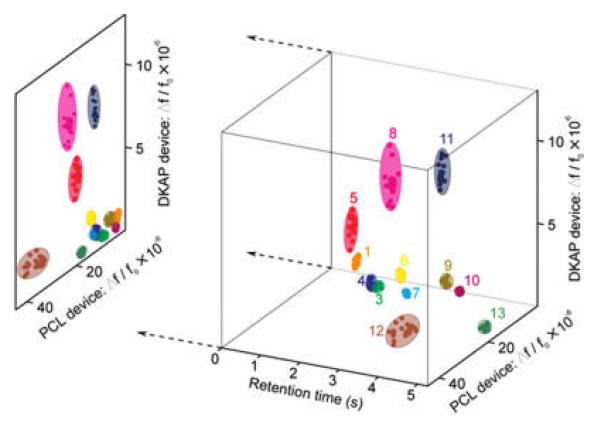
Three-dimensional recognition plot of the 13 analytes, using the DKAP-coated NEMS peak sensor response, the PCL-coated NEMS sensor response, and the GC retention time as the three axes. Each chemical compound was measured individually with the measured frequency shift response normalized to a mass concentration of 1 mg/m 3; each cluster corresponds to twenty independent measurements. The advantages of combining chromatographic separation with multisensor detection can be seen by examining the two-dimensional sensor response space, shown as the projection of the 3D plot. The overlapping sensor responses to several analytes in the 2D space were separated by the third axis of retention time.