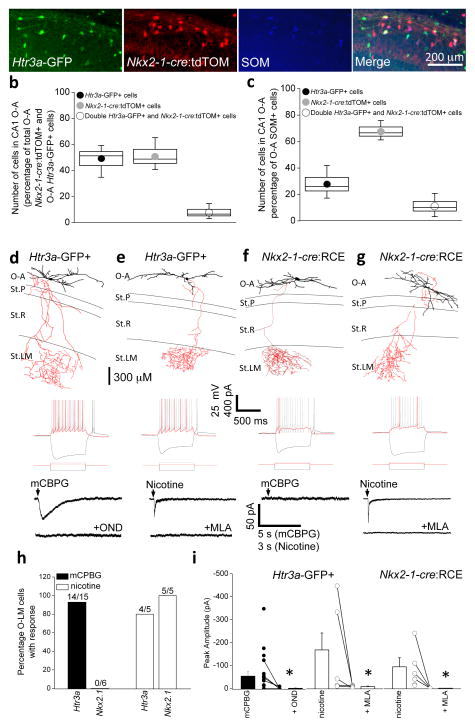
Figure 4. Htr3a-GFP- and Nkx2-1-cre-reported O-LM interneurons are largely non-overlapping subpopulations that are parsed by the functional expression of 5-HT3ARs.
(a) Representative images of SOM immunoreactivity in the CA1 O-A region in transgenic mice reporting both Htr3a-GFP and Nkx2-1-cre:tdTOM. (b, c) Degree of overlap between Htr3a-GFP- and Nkx2-1-cre:tdTOM throughout O-A (b) and specfically within the O-A SOM+ cohort of cells (c). n = 4 mice and counts were performed from a total of 16 hippocampal sections; total number of cells counted in (b) and (c) were 337 and 168, respectively. Box-and-whisker plots are constructed as follows: circle and line within box denotes mean and median, respectively; upper and lower limits of box and capped lines indicate SEM and min/max data points, respectively. (d–g) Representative morphologies of Htr3a-GFP- and Nkx2-1-cre:tdTOM-reported O-LM interneurons. Below each example are electrophysiological membrane and action potential firing responses for hyperpolarizing, near threshold, and 2 × threshold somatic current injections as indicated. Also shown for each O-LM interneuron are traces depicting current responses under voltage-clamp upon puffing of either 1 μM mCPBG or 100μM nicotine (NIC) in the absence or presence of the antagonists 10 nM ondansetron (OND) or 10 nM methyllycaconitine (MLA). (h) Percentage of Htr3a-GFP- and Nkx2-1-cre:tdTOM-reported OLM interneurons that displayed a response to mCPBG or nicotine puff application (the number of cells that responded out of all anatomically confirmed O-LM cells tested are indicated above the bars; data are from 4 – 9 mice). (i) Single data and mean values of peak amplitude of responses to mCPBG or nicotine puff in the absence and presence of OND and MLA, respectively. (*, Wilcoxon Signed-Rank test, p < 0.05). Error bars in (i) denote SEM.

