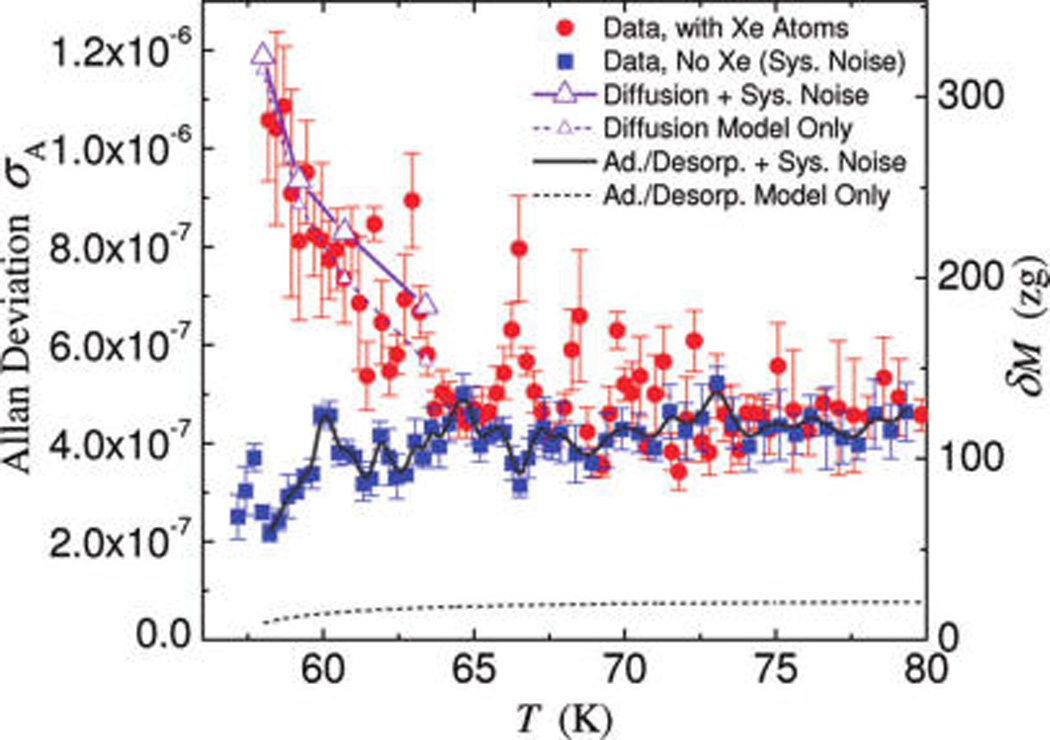
Figure 3.

Frequency instability induced by surface adsorbate fluctuations. Red circles are the measured Allan deviation in the case of constant flux of impinging Xe atoms and blue squares in the case of no Xe flux (system noise floor). In the range of T ≈ 58–80 K, the excess frequency fluctuation due to adsorbed Xe atoms is clearly visible. The dashed lines are excess Allan deviation due to diffusion (violet with small triangles, see entries in Table 1, last column) and pure adsorption–desorption (dark gray), respectively. The solid lines are total instability levels calculated by adding in quadrature the system instability to that due to diffusion (violet with large triangles) and adsorption–desorption (dark gray), respectively. Allan deviation is measured with an averaging time τA = 1 s to ensure adequately dense data with respect to the regulated temperature change. Data symbols are average values and error bars are standard deviations, each computed from ensembles of 500 raw data points.
