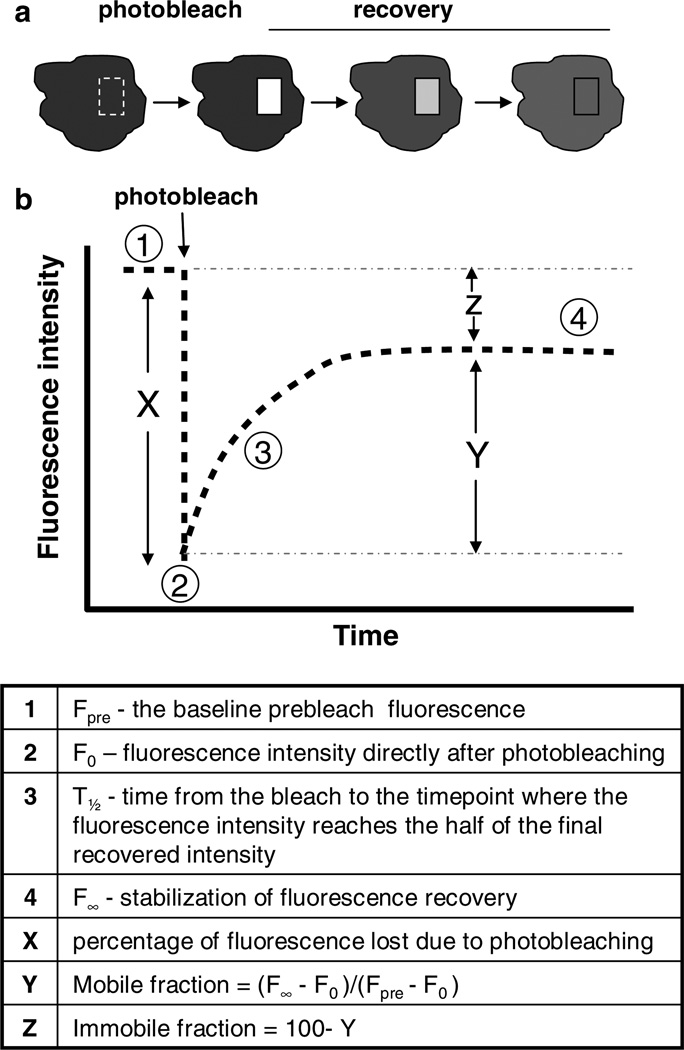
Fig. 1.
FRAP experiment. (a) Illustration of a cell undergoing spot photobleaching.The square box represents the region of interest where photobleaching occurs. Over time, the fluorescence in the region of interest recovers. (b) A characteristic recovery curve of fluorescent molecules within the region of interest. Graphing the prebleach intensity and the resulting recovery establishes the mobile fraction within that region. These numbers can all then be used to determine the half-time of recovery, as well as, the diffusion coefficient (see text for specific calculations).

