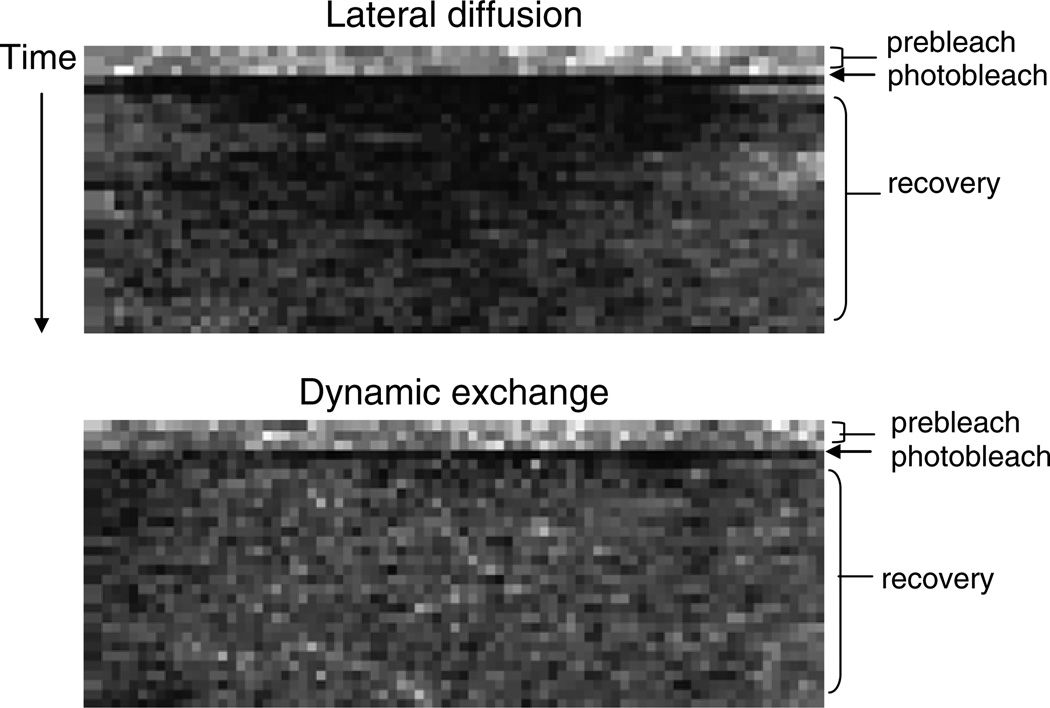
Fig. 2.
Characteristic FRAP kymographs from proteins undergoing either lateral diffusion or dynamic exchange to the membrane. For each frame of a time series, gray values along a line type from the region of interest on the membrane were collected. From these lines of gray values, a new image (the kymograph or time-space plot) was assembled with black boxes representing low fluorescence and white areas being maximal fluorescence. The line read from the first frame of the time series is put down as the first line in the kymograph, the line from the second frame is the second line of the kymograph, and so forth. In this way, the y axis of the kymograph becomes a time axis and the unit is the time interval of the sequence. The x axis is the distance along the line ROI and the unit is the pixel size of your sequence. Notice that the recovery (light boxes) from lateral diffusion of cAR1 occurs first from the sides of the kymograph, then with time, fills in the middle. However, dynamic exchange of PTEN recovers uniformly across the region of interest with recovery occurring immediately from the center and from the sides.

