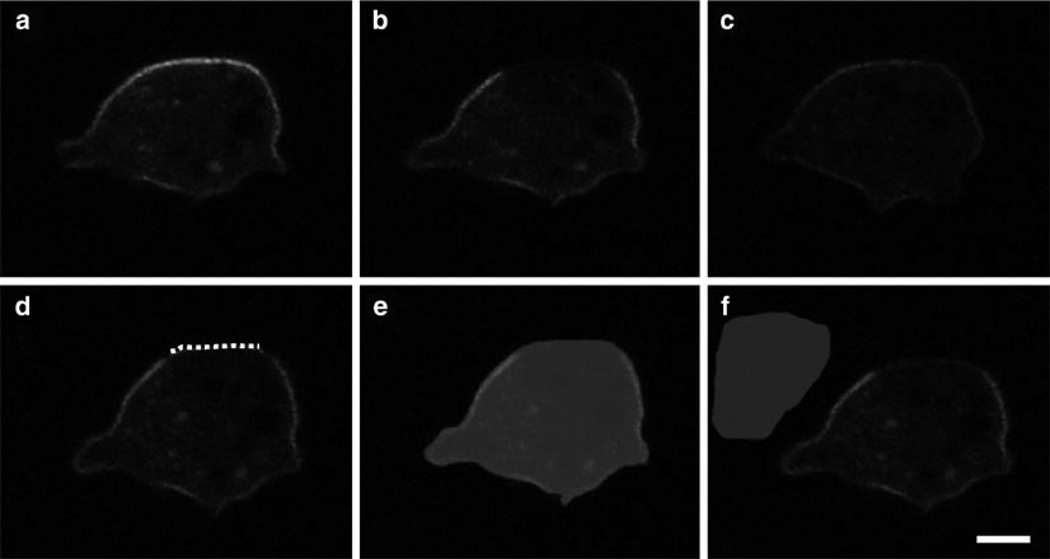
Fig. 5.
Examples of masks from the data analysis of PTEN-YFP in AX3 cells. Images of PTEN-YFP expressed in AX3 wild-type cells are shown prior to photobleaching (a), immediately after (b) and at the end of recovery (c). Example masks for analysis are shown for the membrane (dotted line) (d), whole cell (shaded area) (e), and background (shaded area) (f). Bar equals 3 mm.

