FIG. 3.
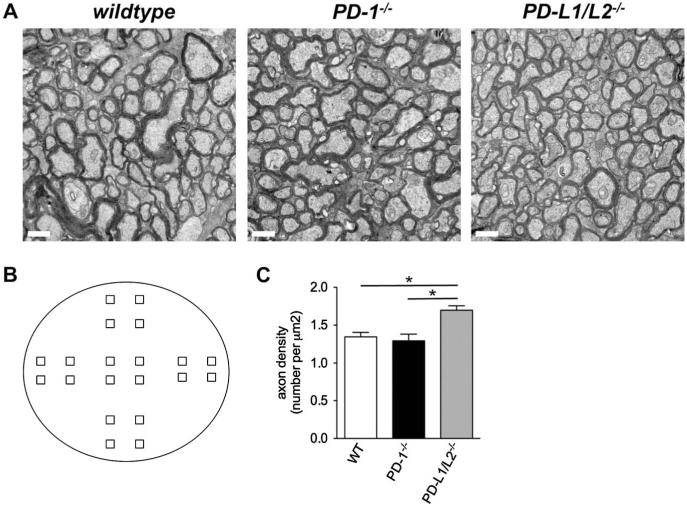
Optic nerve axon analysis in PD-1 and PD-ligand knockout mice. A. Electron micrographs (×21,000) of the central region. Scale bars are 1 μm. B. Optic nerve cross-sectional area: WT (53,624 ± 982), PD-1−/− (52,865 ± 2137), and PD-L1/L2−/− (48,008 ± 363). C. Total axon number: WT (72,107 ± 2113), PD-1−/− (68,141 ± 3574), PD-L1/L2−/− (81,658 ± 3356) (*P = 0.05). D. Axon density: WT (1.35 ± 0.057), PD-1−/− (1.29 ± 0.089), PD-L1/L2−/− (1.70 ± 0.059), *P = 0.01 (WT vs PD-L1/L2−/−), P = 0.02 (PD-1−/− v. PD-L1/L2−/−). E. Schematic representation of location for 20 micrographs taken from each nerve. Central region includes the 4 squares at the center, peripheral region includes the 8 outer most squares, and midperipheral region includes the 8 remaining squares. F. Central region axon number: WT (17,901 ± 582), PD-1−/− (17,337 ± 1409), PD-L1/L2−/− (20,158 ±1081). G. Central region axon density: WT (0.334 ± 0.015), PD-1−/− (0.329 ± 0.031), PD-L1/L2−/− (0.419 ± 0.020), *P = 0.03.

