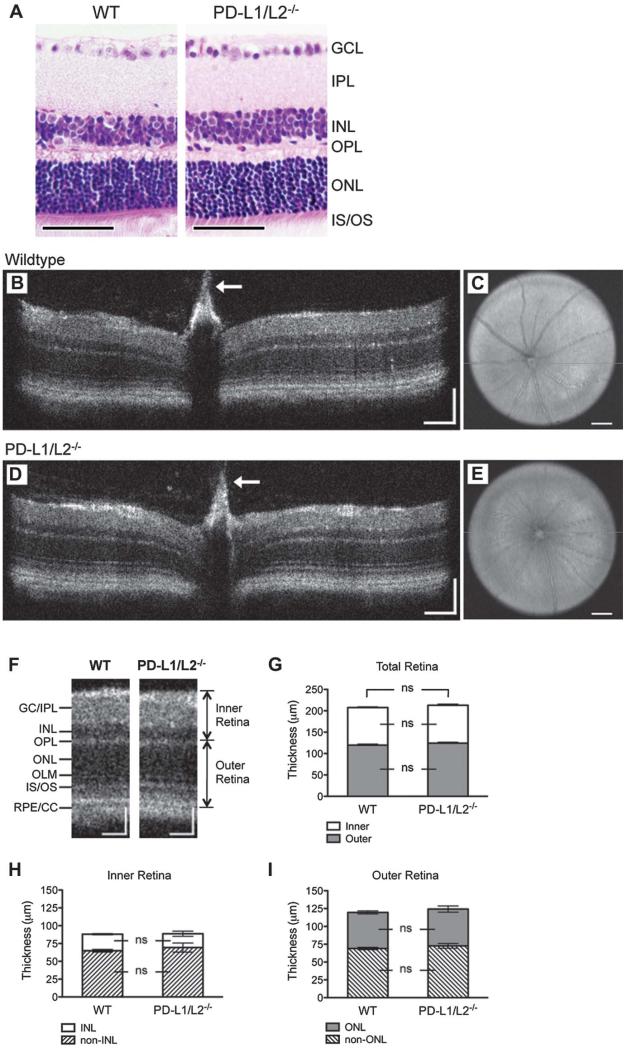
FIG. 4.
Retina architecture in PD-1 and PD-ligand knockout mice. A. Hematoxylin and eosin stain showing gross retina architecture of WT and PD-L1/L2−/− adult mice. Representative B-scan images at the level of the optic nerve head showing a retina crosssection from WT (B) and PD-L1/L2−/− (D) mice. White arrows indicate Bergmeister papilla, a remnant of fetal hyaloid vasculature commonly observed in C57BL/6 mice on spectral-domain optical coherence tomographic imaging. Representative en face C-scans showing fundus images from WT (C) and PD-L1/L2−/− (E) mice, with the horizontal green line indicating orientation of respective B-scans. F. Cropped view of WT (B) and PD-L1/L2−/− (D) B-scans, labeled to indicate retinal layers and landmarks used for quantification of layer thickness. Quantification of inner, outer, and total retina thickness (G), and nuclear layer and nonnuclear layer components of the inner or outer retina (H or I, respectively). GC/IPL, ganglion cell and inner plexiform layers; INL, OPL, ONL, as defined above in Fig. 1; IS/OS, photoreceptor inner and outer segments; OLM, outer limiting membrane; ns, not significant; RPE/CC, retinal pigment epithelium and choriocapillaris. Scale bars = 50 μm (A), 100 μm (both x- and y-axes, B, D, F), or 200 μm (C, E).

