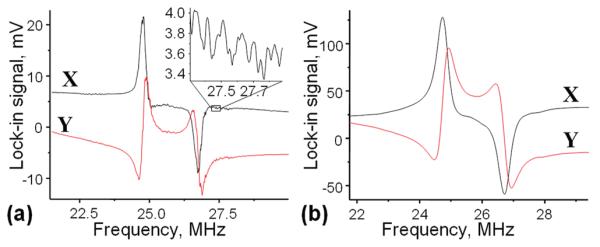
Figure 2.
(a) Resonant response of the two arrays in vacuum. Both quadratures of the lock-in response, X and Y, are shown. The inset shows a zoomed-in version of a part of the measured response curve. Note that the noise level in these measurements was more than an order of magnitude smaller than the amplitude of the rapid variations shown in the inset. (b) Same for measurements in air. Note that the amplitudes of the resonance peaks were much larger than in (a) because much more RF power was applied to drive and detect the resonances in air.

