
Figure 10. Model for SNP effects on gene expression based on EMSA results.
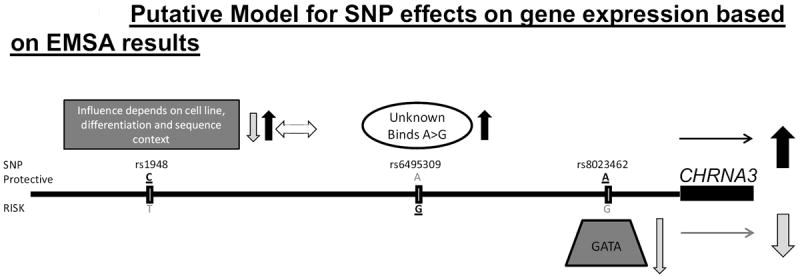
All 3 SNPs are indicated, along with very preliminary putative mechanisms for regulation of gene expression. Mechanisms that increase expression indicated on top, those that decrease expression on bottom. Bold/underline indicates the major allele for each SNP.