
Figure 7. Luciferase expression results from transfected H69 cells.
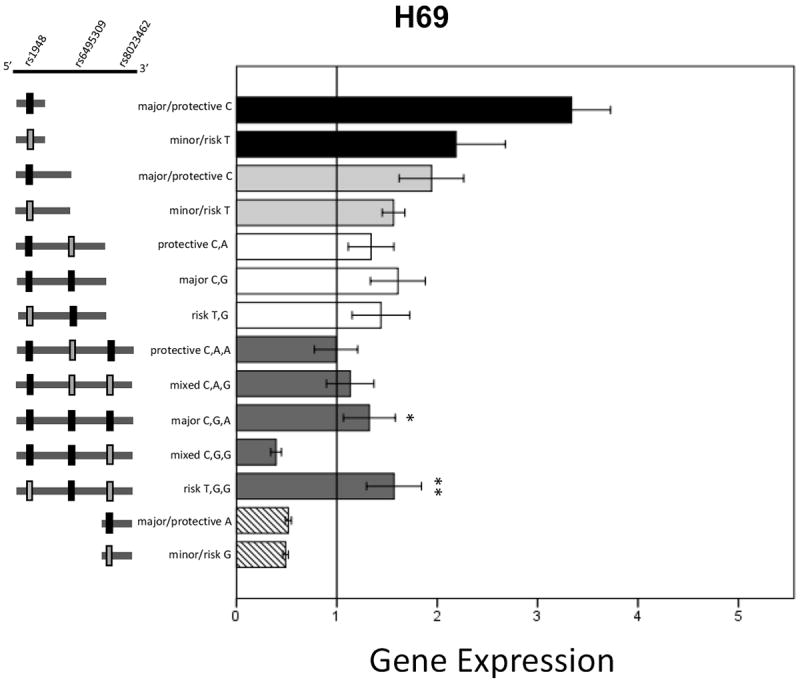
Data are mean +/- SEM. * p<0.05, ** p<0.01. Significant differences indicated are from post hoc Tukey analysis of the 3.5kbp constructs. Asterisks indicate significantly different from 3.5kbp_CGG.