
Figure 5.
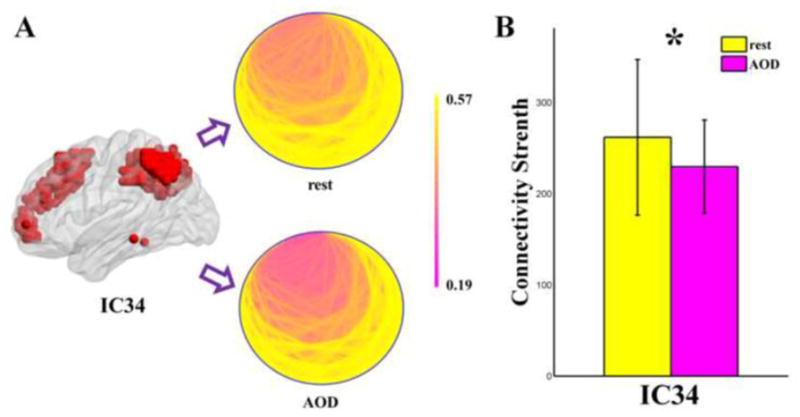
(A) Schematic location (the red color area) and schematic connectivity pattern (all nodes are placed in a small circle, if the nodes close to each other in the brain, they are also close to each other in the circle; color indicates the weight of an edge) of the positive functional segregation brain network (IC34) which are showing state related difference in HC group. (B) this positive functional segregation network is showing higher (P < 0.05 in both t-test and ANOVA, uncorrected, indicated by ‘*’) connectivity strength during resting state than during AOD task only in HC group. The figures of AOD task were plotted based on the results computed by the time courses of 204 time points length. Error bars indicate standard deviations.