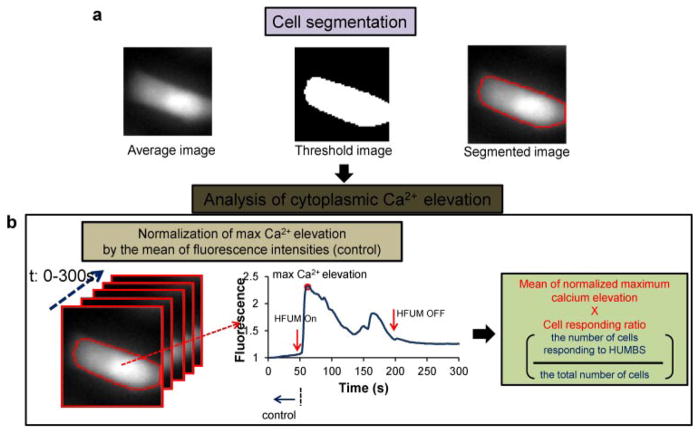
Figure 4.
Quantitative analysis of calcium elevation: (a) cell segmentation. A threshold image of the average (left) of stacked images was formed (middle) with the Otsu’s method, and then the individual cells were segmented (right-panel). (b) Analysis of cytoplasmic Ca2+ elevation. Fluorescence temporal changes were obtained from the segmented stacked images (left), and then the cells exhibiting Ca2+ elevation (middle) were found. Finally, the mean of normalized maximum calcium elevation was multiplied by cell responding ratio to give the cell response index, CRI.

