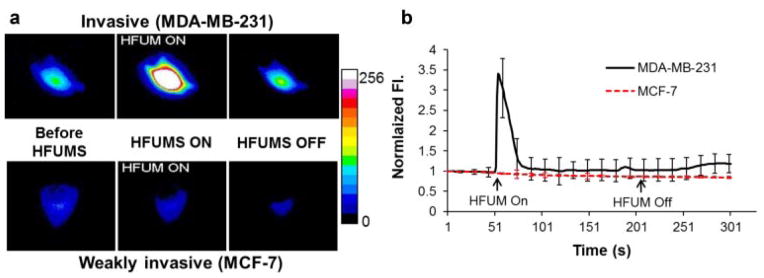
Figure 5.

Ca2+ changes in MDA-MB-231 and MCF-7 cells due to HFUMS: (a) pseudo-color fluorescence images obtained at the indicated time-points (before HFUM On, HFUM On, and after HFUM Off). b: Ca2+ changes over times. HFUM was switched on at 50 s and off at 200 s (input voltage: 32 V, duty factor: 0.0025%, and PRF: 1 kHz).
