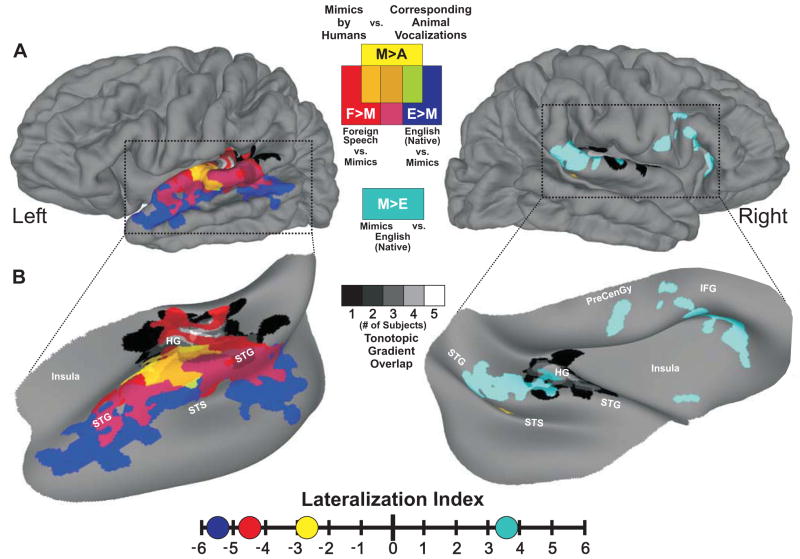
Figure 1.
Conspecific vocalization processing hierarchy in human auditory cortex. A. Group-averaged (n=22) functional activation maps displayed on composite hemispheric surface reconstructions derived from the subjects. B. To better visualize the data, we inflated and rotated cortical projections within the dotted-outlines. The spatial locations of tonotopic gradients from five subjects were averaged (black-to-white gradients) and located along Heschl’s gyrus (HG). Mimic-sensitive regions (M>A) are depicted by yellow hues, sensitivity to foreign speech samples versus mimic vocalizations (F>M) is depicted by red hues, and sensitivity to native English speech versus mimic vocalizations (E>M) is depicted by dark blue. Regions preferentially responsive to mimic vocalizations versus English speech samples (M>E) are depicted by cyan hues. Corresponding colors indicating functional overlaps are shown in the figure key. All data are corrected for multiple comparisons to p<0.05. Adapted and reprinted with permission from Talkington et al., (2012).

