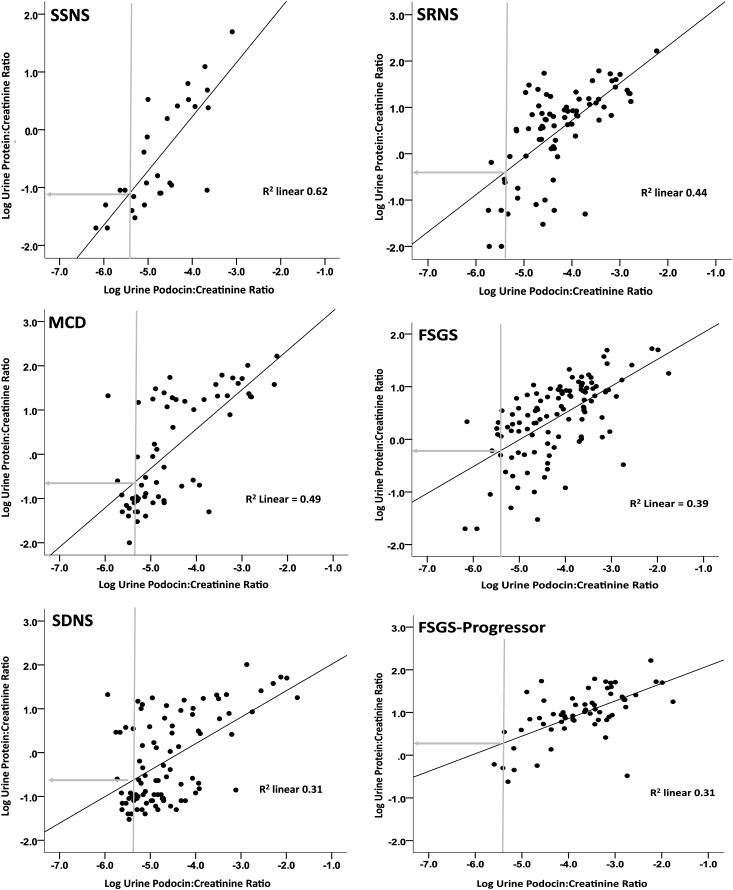
Figure 7.
The correlation slope for UPodCR versus UProtCR is flatter for FSGS and FSGS progressors than for SSNS and MCD, which suggests that change in proteinuria is a less sensitive marker of progression in FSGS. Nephrotic syndrome subgroups are shown as defined in Table 1 as SSNS, SDNS, SRNS, MCD, FSGS, and FSGS progressor patients (see Concise Methods). Individual data points are shown. The calculated slope relating UPodCR to UProtCR is shown for each data set (see also Table 4). Note that the slope in SSNS and MCD is significantly steeper than for other subgroups. In contrast, the slope is significantly flatter for FSGS and flattest for FSGS progressors. The vertical gray line in each panel shows the median normal control UPodCR value. The horizontal gray line shows the predicted average level of proteinuria (UPodCR) corresponding to median control value for UPodCR derived from the slope line, where the Log −1 and Log 0 correspond to UProtCR values of 0.1 and 1, respectively. This change in slope reflects a changed relationship between podocyte detachment rate and proteinuria, probably resulting from uncompensated podocyte detachment leaving a bare area of leaky glomerular basement membrane, as demonstrated in model systems.14,16 As a consequence of this altered slope, if a hypothetical treatment were to successfully reduce the rate of podocyte detachment to the control median value, significant proteinuria would persist in FSGS but not in SSNS/MCD. Proteinuria is therefore a very sensitive marker of the podocyte detachment rate in SSNS and MCD, but a less sensitive marker of the rate of podocyte detachment in FSGS and particularly in FSGS progressors.

