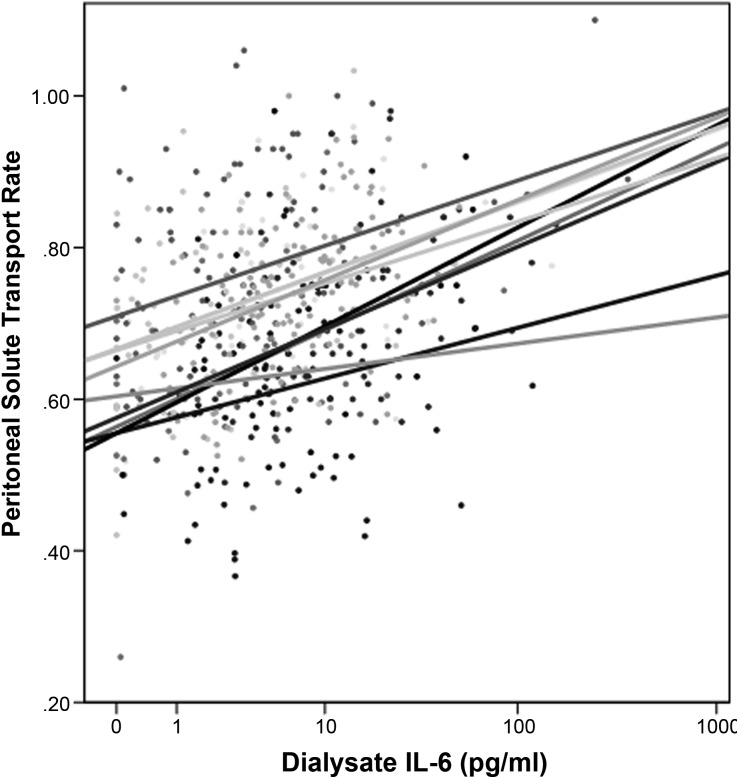
Figure 2.
Scatterplot of PSTR measured as 4-hour dialysate-to-plasma creatinine ratio with dialysate IL-6 demonstrating a center effect. Each line represents a center-specific linear regression slope. Dialysate IL-6 is measured on a logarithmic scale. Despite the center effects seen for many of the measurements in GLOBAL the correlation between dialysate IL-6 and PSTR was always observed.

