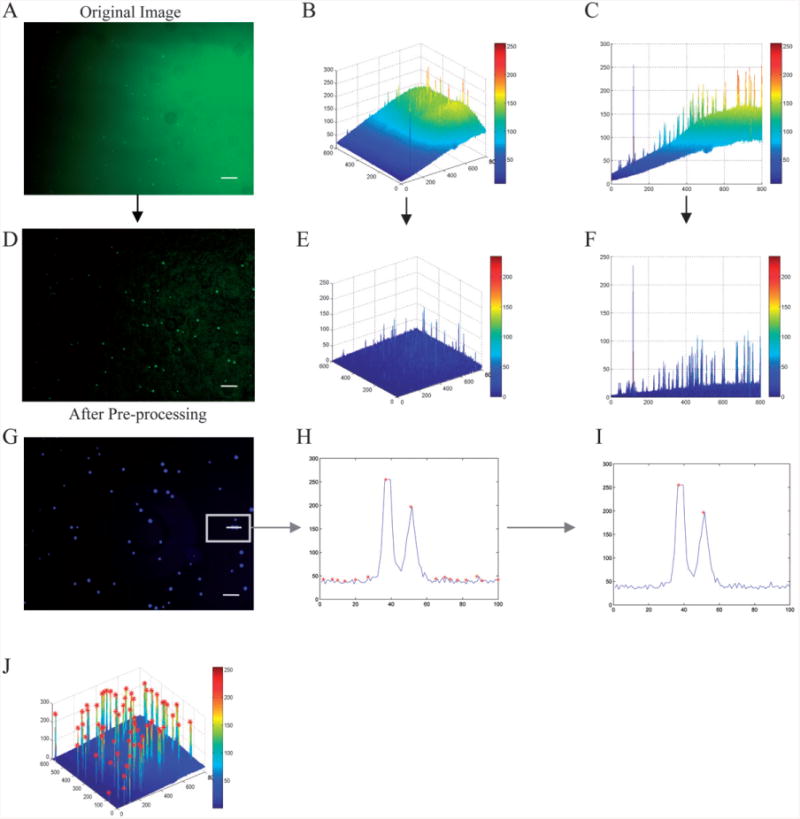
Fig. 1.

Background subtraction and cell detection. The original image (A) is plotted in three dimensions (B). The image was viewed along the x-z axis (C), the background increases from <25 to >150 from left to right. The image was then processed (D) and plotted in three dimensions after background subtraction (E). It was also viewed along the x-z axis (F), the background was always <50 without losing signal intensity for the objects of interest (cells). Detecting a local maximum in the intensity profile across a portion of one image (G), all the local maxima were determined (H), a local thresholding method was then applied to the image to separate cells from background (I). Local maxima followed by local thresholding was applied to the image, shown in 3-D (J). In (B,E) the x-y axis labeling corresponds to pixels whereas the z axis labeling corresponds to intensity. In (C,F,H,I) the x axis labeling corresponds to pixels whereas the y axis labeling corresponds to intensity (8bit, 0∼255). The scale bar is 100 μm.
