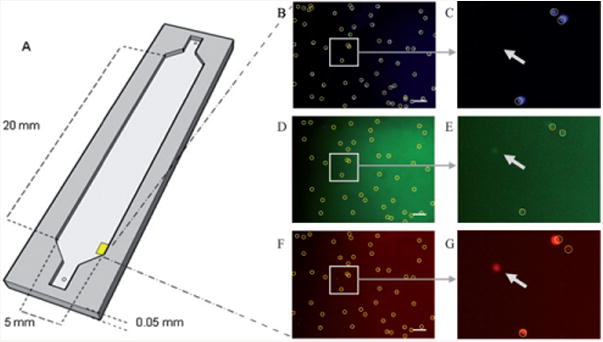
Fig. 2.

Drawing of the microfluidic device used to capture T lymphocytes using surface chemistry (A). Fluorescent images of cells stained with DAPI (B), CD4 (C), and CD3 (D). All cells in the DAPI image are marked. The DAPI image is used as a base for CD4 and CD3. The location of each cell in the DAPI image is compared to that in the processed CD4 and CD3 images. If a cell candidate in those images exceeds a certain threshold, the program marks it as a cell. The circle indicates what the program considers “a cell”; the arrows show objects that are not considered cells since they were not found in all three stains. Scale bar corresponds to 100 μm.
