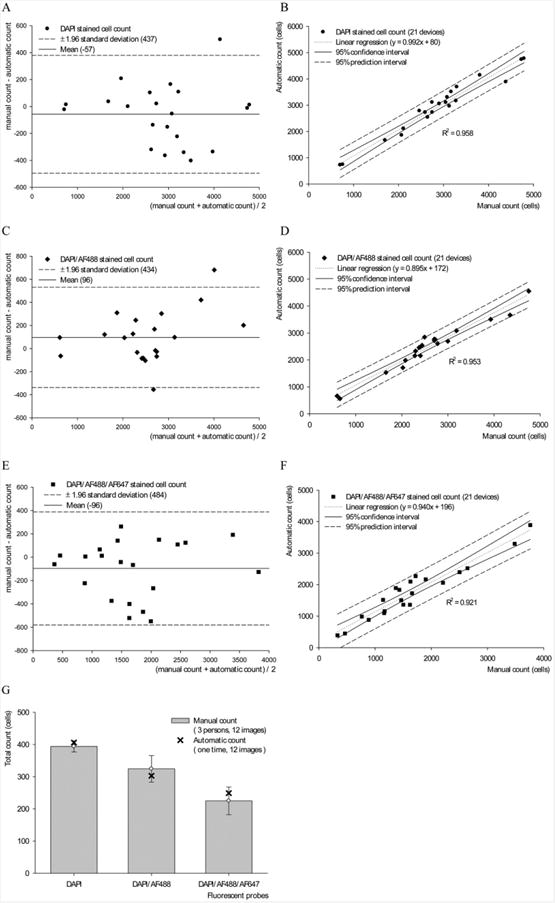
Fig. 4.

Statistical analysis of the automated and manual counts of DAPI, CD4+, and CD3+ stained images. Bland-Altman plot of the automated versus the manual count of DAPI+, DAPI+/CD4+ and DAPI+/CD4+/CD3+ cells, (A–C) showing the error and limit of agreement. Comparison using Passing and Bablok Regression is shown (E–G), with the 95% confidence interval and the regression equation. The variability of manual counting was obtained by having 3 counters counting the same 12 sets of images (D). We notice that the variability (error bars) increased when the task was to identify multiple stains; the automated count was within the standard deviation for all three cases. R2 values were 0.958, 0.954, and 0.921 for E, F, and G, respectively.
