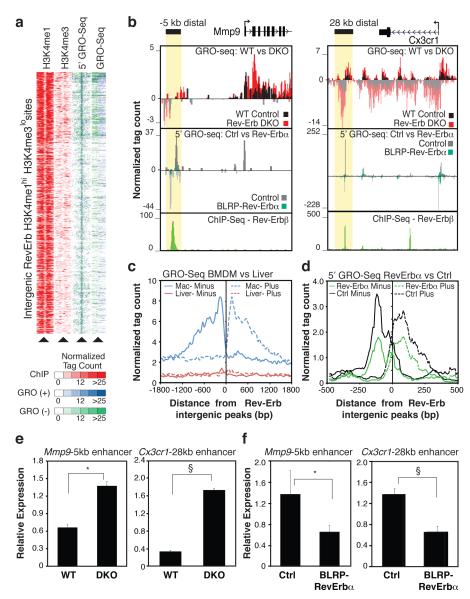
Figure 2. Rev-Erb negatively regulates enhancer transcription.
a, Cluster plot of tag counts for H3K4me1 and H3K4me3 ChIP-Seq, 5’GRO-Seq and GRO-Seq at 544 intergenic Rev-Erb bound, H3K4me1hi H3K4me3lo regions. b. Genomic loci for Mmp9 and Cx3cr1 showing indicated tag counts for GRO-Seq, 5’GRO-Seq and Rev-Erbβ. c, Distribution of averaged macrophage GRO-Seq eRNA signal in macrophages flanking Rev-Erb intergenic sites defined in macrophages (n = 544, blue) and Rev-Erb intergenic sites defined in liver (n = 521, red8). d, Distribution of average 5’GRO-Seq signal from Rev-Erbα overexpressing (green) and control RAW264.7 macrophages (black) flanking the top 100 Rev-Erb-sites. e, Q-PCR analysis of the −5kb Mmp9 and 28kb Cx3cr1 eRNAs in Rev-Erb DKO (top, N WT = 6, and N DKO = 5) and f, Rev-Erbα overexpressing RAW264.7 macrophages (bottom, Nctrl = 13, Nalpha = 14 independent lines). Data represent mean + s.e.m. *, P < 0.01, § P < 0.005, versus control by two tail Student’s t-test.

