
Figure 2.
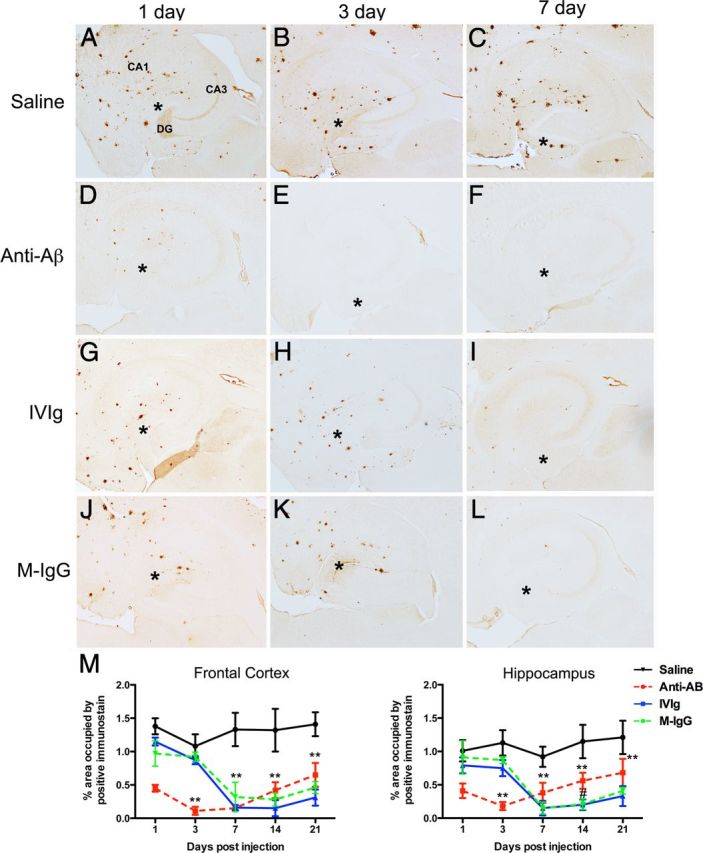
Brain Aβ is reduced by anti-Aβ antibodies, IVIg, and mouse IgG. A–C, Show the hippocampus of mice receiving saline 1 (A), 3 (B), and 7 (C) d following injection. D–F, Show the hippocampus of mice receiving anti-Aβ antibody 1 (D), 3 (E), and 7 (F) d following injection. G–I, Show the hippocampus of mice receiving IVIg 1 (G), 3 (H), and 7 (I) d following injection. J–L, Show the hippocampus of mice receiving mouse IgG 1 (J), 3 (K), and 7 (L) d following injection. In A, the dentate gyrus (DG), cornu ammonis 3 (CA3), and cornu ammonis 1 (CA1) regions are indicated to provide orientation. Asterisks in A–L indicate the injection site within the hippocampus. M, Shows quantification of Aβ across the full time course, from 1 to 21 d, in the frontal cortex and hippocampus. **p < 0.01 compared with saline for all points under the asterisk; #p < 0.05 for IVIg and mouse IgG compared with anti-Aβ antibody.