Figure.

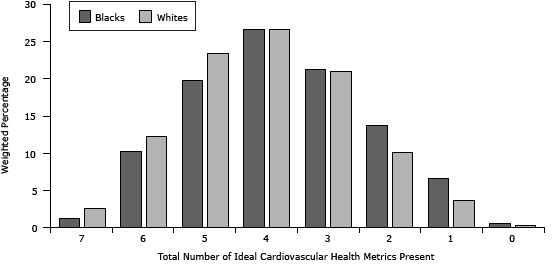
Distribution of number of ideal cardiovascular health metrics present by race, Mississippi Behavioral Risk Factor Surveillance System, 2009. Mean number of ideal cardiovascular health metrics present: blacks, 3.73 (95% CI, 3.63–3.83); whites, 4.02 (95% CI, 3.97–4.07); analysis of variance P value < .0001. Sample sizes before weighting: blacks = 2,003; whites = 5,125. Percentages refer to weighted prevalence.
| Total Number of Ideal Cardiovascular Health Metrics Present | Blacks, % |
Whites, % |
|---|---|---|
| 7 | 1.3 | 2.6 |
| 6 | 10.2 | 12.3 |
| 5 | 19.7 | 23.4 |
| 4 | 26.5 | 26.6 |
| 3 | 21.2 | 20.9 |
| 2 | 13.7 | 10.1 |
| 1 | 6.6 | 3.7 |
| 0 | 0.62 | 0.37 |
