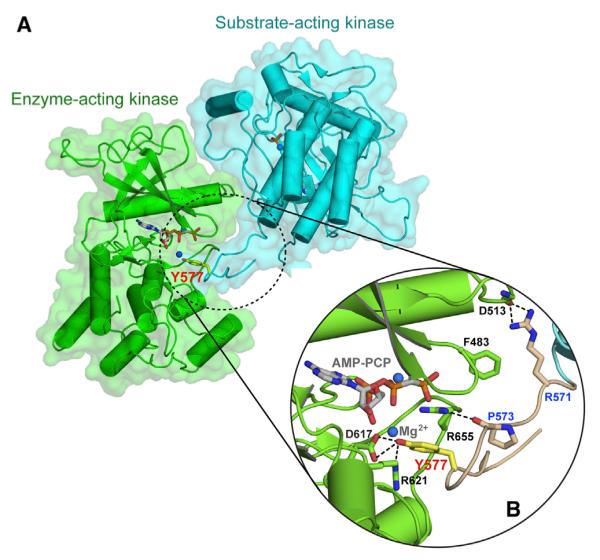
Figure 2. Crystallographic Snapshot of the Kinase Insert trans-Phosphorylation Reaction.

(A) The substrate-acting kinase (in cyan) interacts with both N- and C-lobe of the enzyme-acting kinase (in green) during the trans-phosphorylation on Y577.
(B) A detailed view of the interface formed between the enzyme-acting and substrate-acting kinases. The interacting residues are shown as sticks and labeled in black for the enzyme-acting kinase and in blue for the substrate-acting kinase. The kinase insert region is colored wheat, and the side chain of the Y577 residue is shown as yellow sticks and labeled in red. The hydrogen bonds are shown as black dashed lines. Atom coloring is as in Figure 1.
See also Figure S1.
