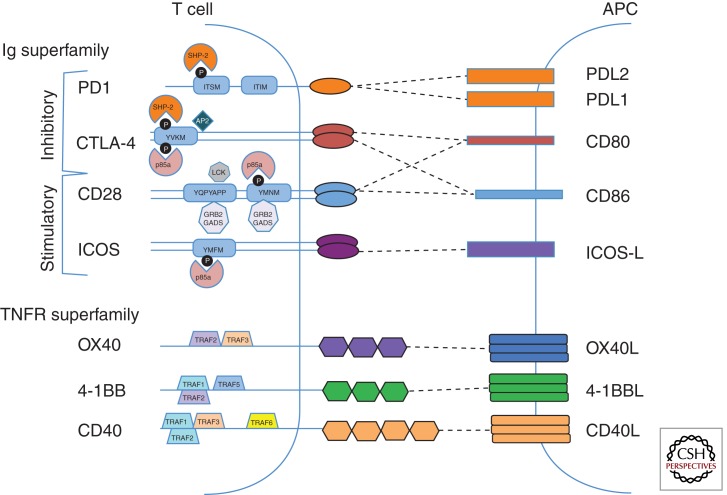
Figure 1.
Costimulatory molecules and proximal signaling components. Immunoglobulin superfamily (top) and TNF superfamily receptors (bottom) expressed on T cells are shown on the left. Ligands are depicted in the antigen-presenting cell (APC) on the right. Dotted lines represent receptor–ligand pairs. Signaling motifs within the cytoplasmic tails are indicated in blue rectangles. Black circles represent phosphorylatable tyrosines. Proteins that interact directly with the cytoplasmic tails of costimulatory molecules are shown. Details of the signal transduction proteins are described in the text.

