
Figure 5.
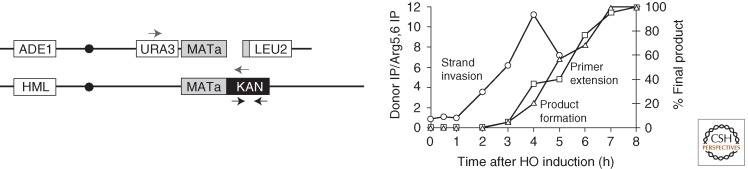
Kinetics of BIR. Schematic representation of a diploid BIR strain used to measure the kinetics of BIR, where there is only homology to the left of the DSB (left). Black arrows represent the position of primers used for ChIP analysis. Gray arrows represent the position of primers used for primer extension assay. The graph (right) shows the kinetics of strand invasion (circles), initiation of new DNA synthesis (squares), and product formation (triangles). (Figure modified from Jain et al. 2009.)