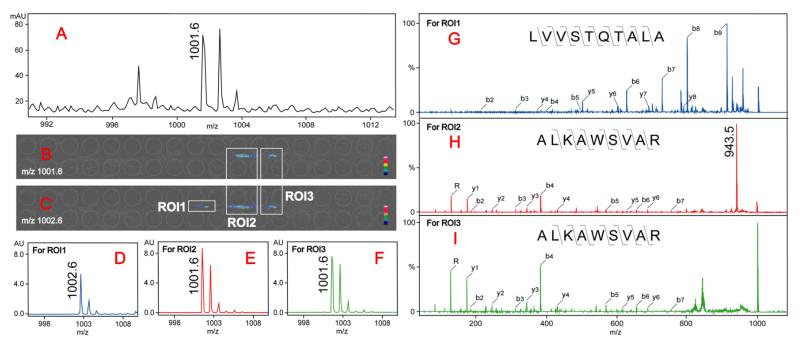
Fig. 3. Identification and characterization of overlapped tryptic peptides with LC-MSI.
A: MS full scan showing the m/z 1001.6 peak. B and C: the images of mass filters centered at m/z 1001.6 (B) and m/z 1002.6 (C). The colored regions of putative peptides separated in the images are marked with white boxes as regions of interest (ROIs). D-F: The extracted ion spectra from three ROIs showing the separated putative peptides. G-I: CID fragmentation spectra of selected parent ions from three ROIs showing different peptide sequence (ROI1) and secondary structures (ROI2 and ROI3) separated by LC-MSI.

