Figure 3.

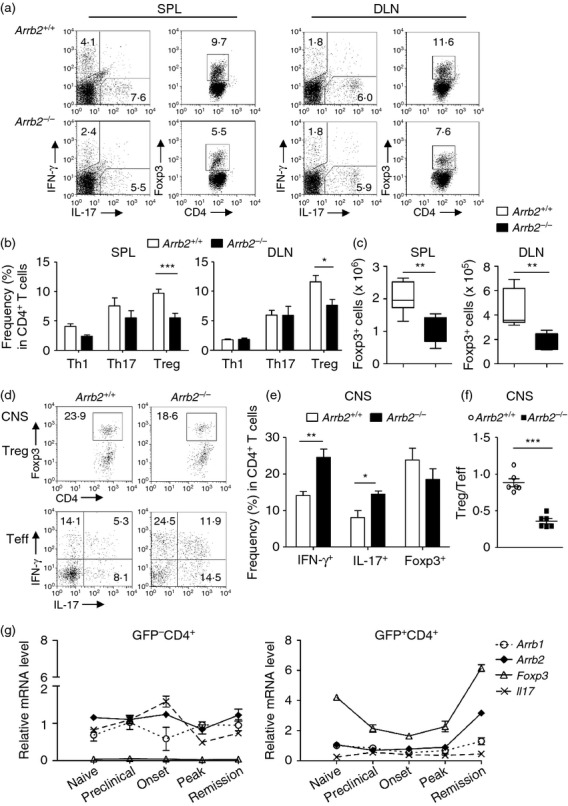
Number of peripheral Foxp3+ CD4+ T cells is decreased in Arrb2−/− experimental autoimmune encephalomyelitis (EAE) mice. (a–c) Mononuclear cells were isolated from the spleens (SPL) and draining lymph nodes (DLN) of Arrb2+/+ and Arrb2−/− EAE mice on day 22 after immunization. (a) Representative flow cytometry graphs show the frequencies of interferon-γ+ (IFN-γ+) (T helper type 1; Th1), interleukin-17+ (IL-17+) (Th17), and Foxp3+ CD4+ (regulatory T; Treg) cells among CD4+ population in SPL (left) and DLN (right), respectively. (b) Quantification of data in (a). (c) Quantification of absolute numbers of Foxp3+ CD4+ Treg cells in SPL or DLN (n = 7). (d–f) Central nervous system mononuclear cell infiltrates were isolated from Arrb2+/+ and Arrb2−/− EAE mice on day 22 post immunization. (d) Representative flow cytometry graphs show the frequencies of Treg cells as well as T effector cells in CD4+ gate, respectively. (e) Quantification of data in (d). (f) Calculation of the ratio of frequencies of Treg cells to T effector cells (a sum of all Th1, Th17 as well as IFN-γ+ IL-17+ cells) in CD4+ cells from the central nervous system lesions of Arrb2+/+ and Arrb2−/− EAE mice (n = 7 for either genotype); (g) GFP+ CD4+ cells (indicative of Foxp3-expressing Treg cells) from either naive or EAE-affected Foxp3egfp mice of distinct disease stages were purified from splenocytes by FACS sorting. Quantitative PCR was performed to analyse gene expression profiles. Gene transcript levels are calculated as the ratio of copy numbers relative to the hprt ‘housekeeping’ gene in the same sample. Data are presented as means ± SEM (n = 5) and are representative of three independent experiments. *P < 0·05, versus wild-type control (two-tailed Student's t-test)
