Figure 5.

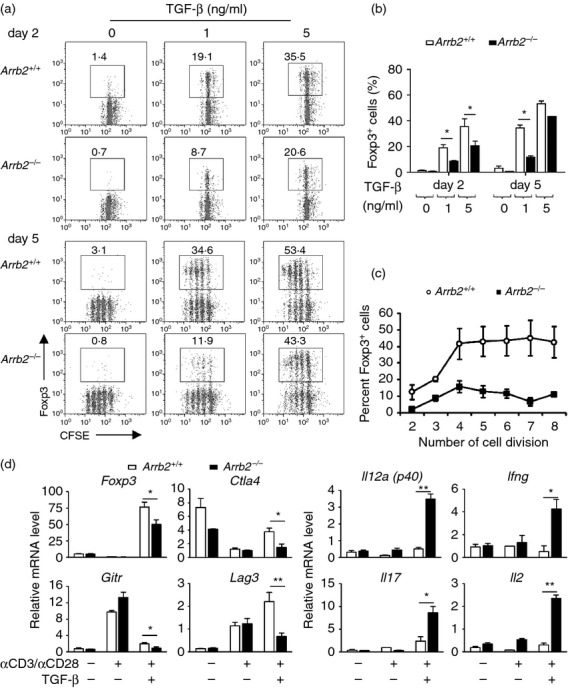
Naive (CD25− CD4+) T cells purified from spleens of Arrb2−/− or Arrb2+/+ mice were labelled with CFSE and cultured with anti-CD3 and anti-CD28, in the presence of increasing concentrations of transforming growth factor-β (TGF-β; 0, 1, 5 ng/ml). Cells were harvested for analyses on day 2 and day 5, respectively. (a) Representative flow cytometry graphs show the generation of Foxp3+ cells in Arrb2−/− or Arrb2+/+ inducible regulatory T (iTreg) cell cultures at the indicated time-points (upper panel, day 2; lower panel, day 5). Numbers adjacent to outlined areas indicate frequency of Foxp3+ cells within the CD4+ gate. (b) and (c) Quantification of results in (a). Data were shown as mean ± SEM from three independent experiments. (d) Quantitative PCR analyses of gene expressions in Arrb2−/− or Arrb2+/+ CD4+ T cells both untreated (naive) or anti-CD3 plus anti-CD28 activated in the presence or absence of 1 ng/ml TGF-β for 2 days. Gene transcript levels are calculated as the ratio of copy numbers relative to the hprt ‘housekeeping’ gene in the same sample. Data for an individual gene expression in different samples are shown as the fold change (means ± SEM, from three independent experiments) of its transcript level assessed in Arrb2+/+ cells activated in the absence of TGF-β. *P < 0·05 (two-tailed Student's t-test).
