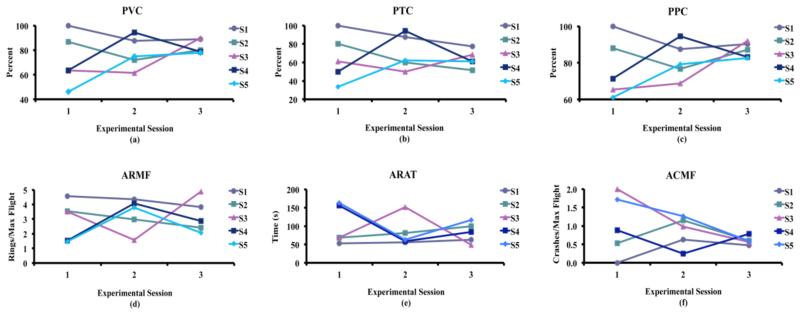
Figure 9.
Experimental performance metrics are reported over three subject visits (Three experimental sessions). The top row, from left to right, reports percent valid correct (a), percent total correct (b) and percent partial correct, respectively. These metrics reflect the average accuracy of each subject’s control as calculated under different criteria for successful task completion. The bottom row reports, from left to right, average rings per maximum flight (d), average ring acquisition time (e) and average crashes per maximum flight (f). (d) and (e) reflect the speed with which subjects pursued the presented targets, while (e) is a metric of continuity and safety of control.

