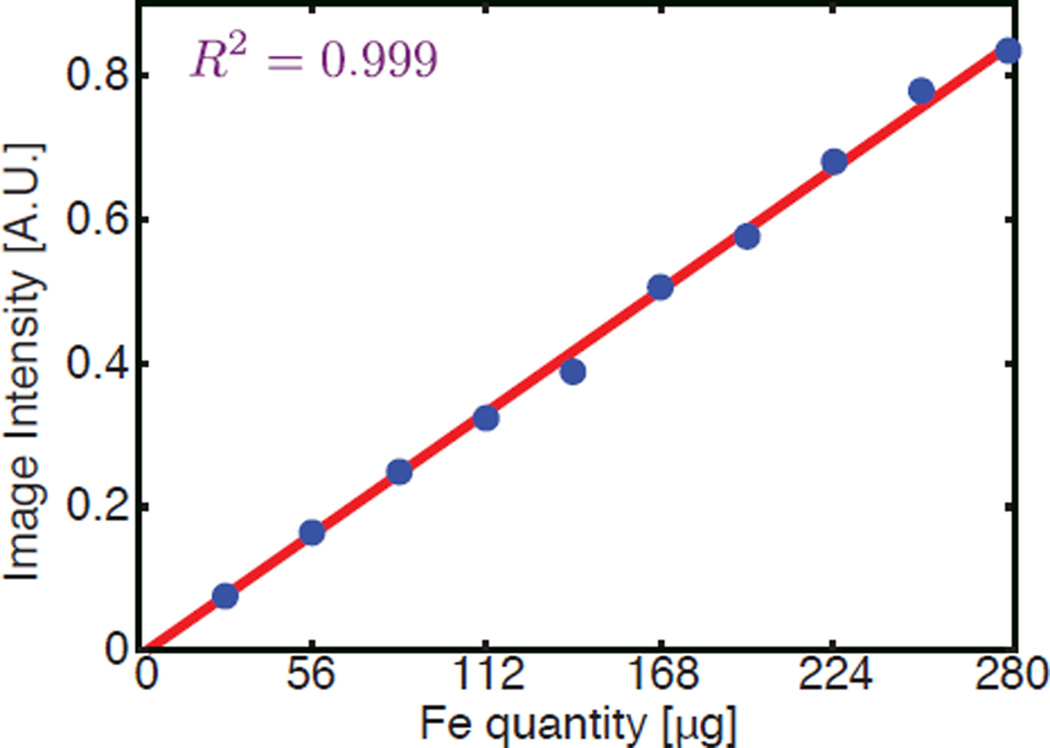
Figure 8.
Experimental demonstration of MPI’s linearity after recovery and stitching. The peak intensity of the corresponding MPI image is linearly proportional to the input particle quantity, showing a near-perfect correlation coefficient (R2 = 0.999). The amount of iron tested ranges from 28 µg to 280 µg, with a step size of 28 µg. An image of 1 cm by 1 cm is taken and reconstructed for each sample, and the peak value of each impulse response is plotted.

