
Fig. 1.
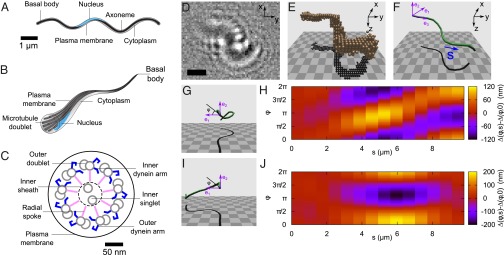
Longitudinal (A) and angled (B) cross-sectional illustrations show the simplicity of a typical P. berghei microgamete. The sketches are based on electron micrographs in studies by Straschil et al. (27) and Sinden et al. (26), and are labeled to show the key features of the flagellum. (C) Cross-sectional schematic diagram of a microgamete detailing the elements common to a typical 9+2 axoneme. The flagellar waveform is driven by microtubule doublets, which, in turn, are driven by the shearing force generated by the dynein arms. (D) Raw holographic data of a P. berghei microgamete. (Scale bar = 3 μm.) (E) Reconstructed volume pixels (voxels), derived from data in D, encompassing the volume occupied by the microgamete. The z axis is the illumination direction. (F) Segmented contour fitted to the voxel data in E. The contour length s increases from tail to head, and the purple axes show the material reference frame, with e3 lying along the gamete center line, in each segment. (G) Quasihelical waveform. At each joint, the material reference frame rotates about a line in the e1e2 plane, at an angle φ to the e1 axis. The e3 vector then points along the next segment. The material reference frame is thus fixed to the underlying structure of the gamete (the microtubules), which allows us to extract the differential shear at each joint. (H) Differential shear map corresponds to the waveform in G. In the absence of twist, the microtubules would lie parallel to the horizontal axis, at an unknown φ offset. The diagonal feature indicates that a wave of sliding has passed circumferentially around the gamete. (I) Example of a quasiplanar waveform. (J) Differential shear in the flagellum (analyzed in the same way as for H corresponding to the waveform in I).