Fig. 2.
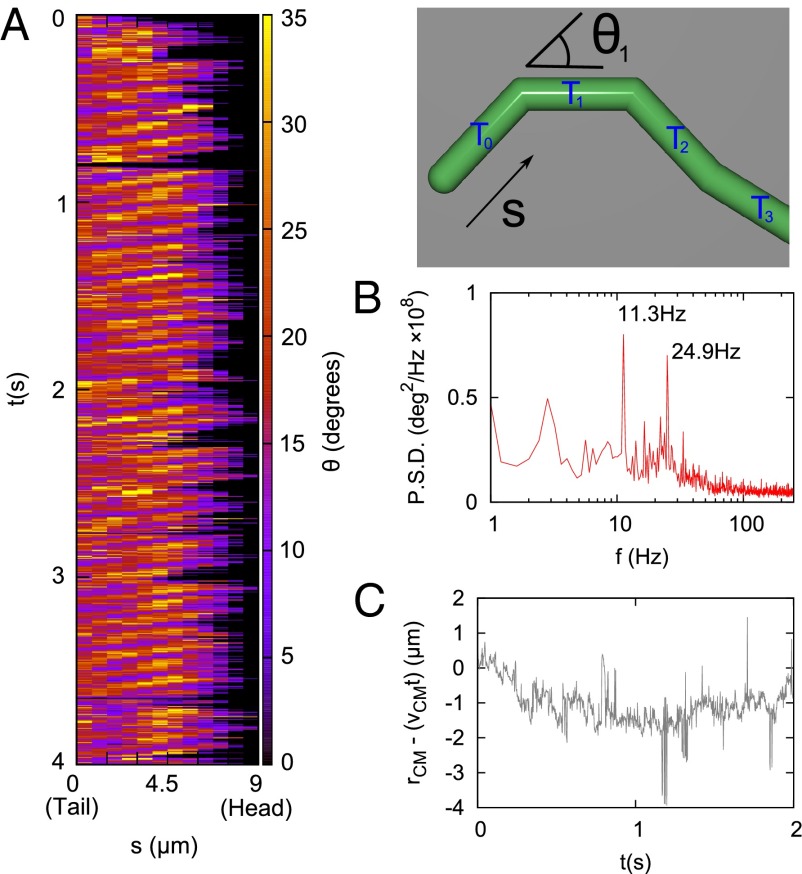
(A) Exterior angle θ (Left), as indicated (Right), between two adjacent segments as a function of contour length s (micrometers) and time (seconds). The bright bands inclined from the upper right to the lower left show waves of curvature passing along the gamete from the “head” end (s = L) to the “tail” end (s = 0) of the gamete. (B) Power spectrum of curvature fluctuations, with harmonic components as indicated. P.S.D., power spectral density. (C) Deviation from linear swimming speed. A straight-line fit was performed to 4 s of center-of-mass displacement data to find a straight line speed of 6.2 μm/s. This graph of residuals (rCM − vCMt) shows no evidence of the beat frequency in the center-of-mass displacement.

