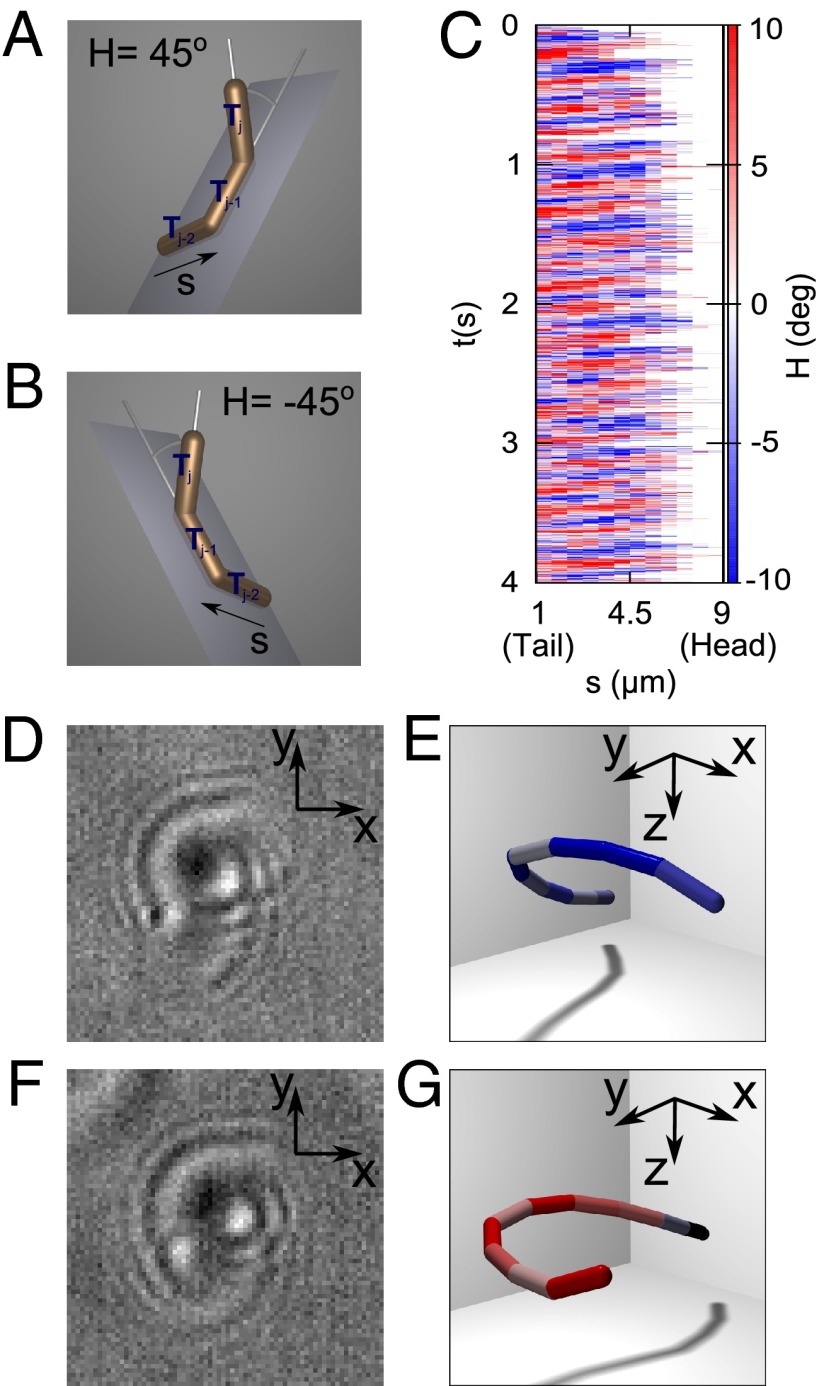
Fig. 3.
(A and B) Demonstration of how we define local chirality using three contiguous segments of the contour. H is the angle between the third segment and the plane of the first two segments. The sign is determined as positive (right-handed) if Tj lies in the same half-space as the cross-product Tj−2 ∧ Tj−1 and as negative (left-handed) if not. (C) Temporal pattern of local chirality as a function of contour length s and time. The bands correspond to those in Fig. 2A, but waves alternate in time between left- and right-handed character. deg, degrees. (D) Raw data correspond to a left-handed waveform with holographic reconstruction in E. (F and G) Raw and reconstructed data for a right-handed structure. Note the superficial similarity of D and F; the fundamental difference in the waveform is revealed only with holographic reconstruction. The photos (D and F) are 17 μm on a side.

