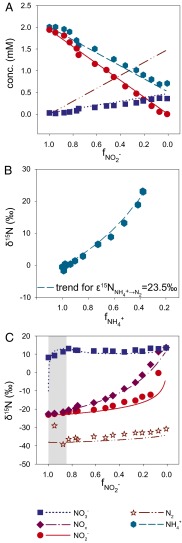
Fig. 1.
Anammox stoichiometry and natural abundance isotope fractionation. (A) Consumption of ammonium and nitrite and production of nitrate agree with anammox stoichiometry (Exp. C3_a). (B) Ammonium N isotope fractionation follows closed-system Rayleigh kinetics (Exp. C3_b). (C) The NOx N isotope fractionation is influenced by isotope exchange between nitrite and nitrate (gray area), which is superimposed on kinetic isotope effects (Exp. C3_a). The x-axis labels  and
and  refer to the fraction of remaining nitrite and ammonium, respectively. Symbols represent data, lines are modeled trends, and the concentration and isotope composition of N2 was calculated from NOx.

