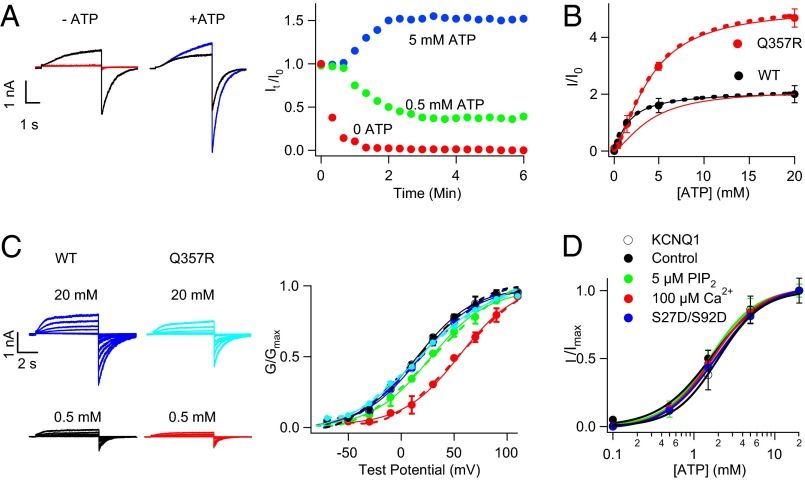
Fig. 1.
ATP-dependent activation of IKs channels. (A) KCNQ1 + KCNE1 (hIKs) currents in inside-out patches run down or up in 0 (red), 0.5 (green), and 5 mM (blue) [ATP] from that immediately after patch excision (black, I0). Voltage pulses were +80 mV from a −80-mV holding potential. (Right) It, I0 tail current amplitudes. (B) ATP dose–response of WT (black) and Q357R (red, also scaled to the WT currents at 20 mM ATP) IKs, and fits to the Hill equation (solid curves) with Hill coefficient 1 and 1.1, and EC50 1.66 and 9.60 mM, respectively. (C) Currents of WT (Left) and Q357R (Center) hIKs recorded from inside-out patches and G–V relations after patch excision in solutions containing various [ATP]. Solid curves are fits of Boltzmann equation (Right; Materials and Methods) with V1/2 (mV) at 0.5, 5, and 20 mM [ATP], respectively: WT, 23.7 ± 3.5 (black), 25.6 ± 3.2 (purple), 25.4 ± 5.0 (blue); Q357R, 53.2 ± 2.5 (red), 30.8 ± 2.6 (green), and 26.2 ± 3.8 (cyan). (D) Normalized ATP dose–response of WT hIKs channel activation in control solution [PIP2] = 100 µM (black), 5 µM PIP2 (green), 100 µM Ca2+ (red), and S27D/S92D hIKs in control solution (blue; Materials and Methods). Five and 100 µM [PIP2] are 50% and 100% of saturation for IKs channel activation, respectively (14). Dashed curves in B and C are the fittings of the model in Fig. 7A.

