Fig. 5.
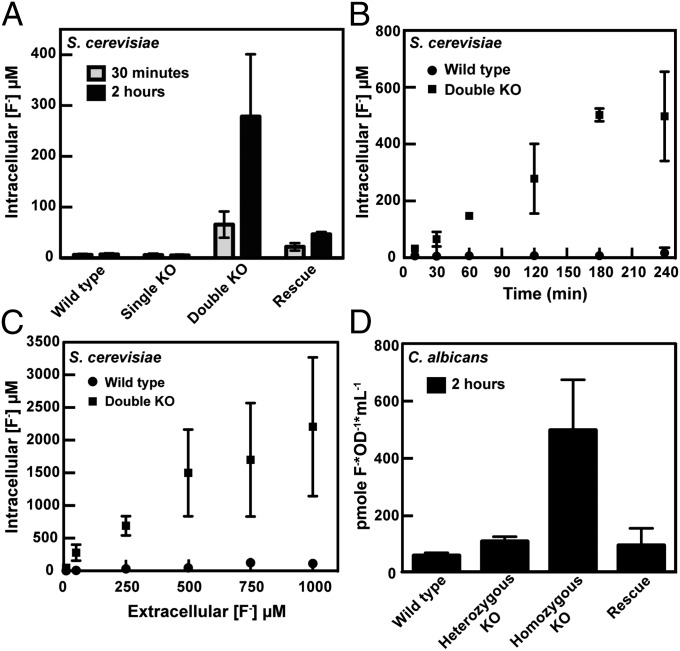
Intracellular fluoride concentrations in S. cerevisiae and C. albicans. Values graphed are the average of at least three measurements ± the SD. (A) Intracellular concentration of fluoride for S. cerevisiae strains after incubation with 50 μM NaF. (B) Intracellular fluoride concentration as a function of time for WT and double KO S. cerevisiae. Cells were incubated with 50 μM NaF. (C) Intracellular fluoride concentration as a function of external fluoride concentration for WT and double KO S. cerevisiae. All samples were incubated for 2 h before scintillation counting. (D) Intracellular fluoride concentration of C. albicans strains. Cells were incubated with 500 μM fluoride for 2 h.

