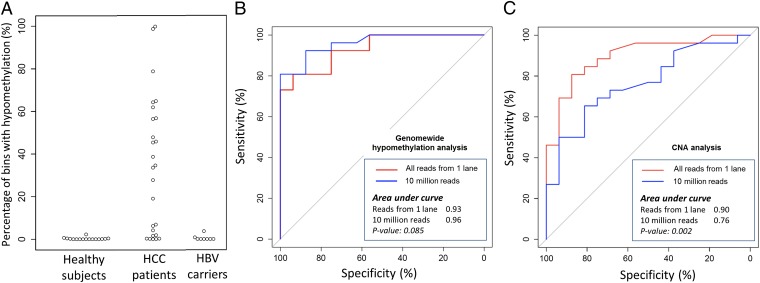
Fig. 3.
Percentage of bins showing hypomethylation in HCC patients and chronic hepatitis B virus (HBV) carriers with cirrhosis (A). ROC curves for HCC patient detection using hypomethylation (B) and CNA (C) analyses. The P values shown are for the comparisons between using all sequenced reads from one lane and using 10 million reads.

