Fig. 2.
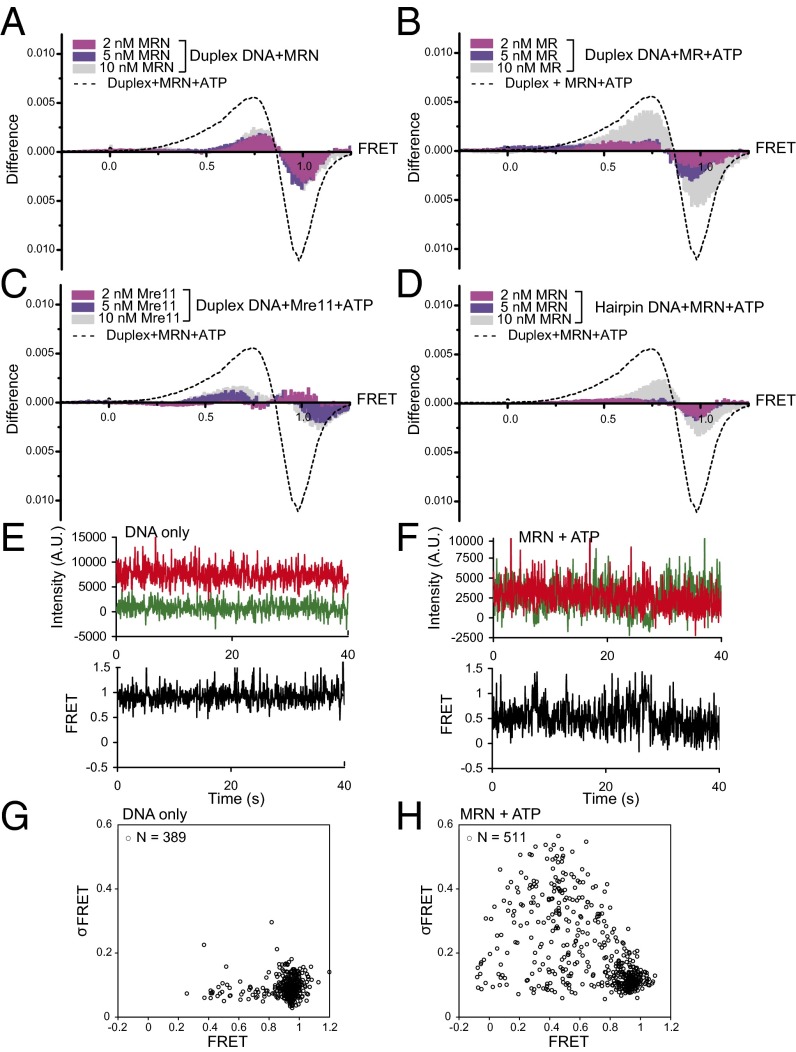
The MRN duplex opening is ATP-dependent and requires a DNA end. (A) Difference plots as in Fig. 1 showing the effects of ATP on MRN-induced low-FRET states with Cy3/Cy5 duplex DNA. The dotted curve represents the difference plot from Fig. 1G, the effect of 10 nM MRN on FRET values in the presence of ATP. (B and C) Difference plots as in A but with MR and Mre11 protein, respectively. (D) Difference plot as in A but with hairpin substrate (Fig. 1A). (E and F) Representative FRET traces for individual molecules of immobilized DNA with DNA only (E) or with MRN and ATP (F). (G and H) Average FRET values for Cy3/Cy5 duplex DNA molecules incubated alone (G) or with MRN and ATP (H), with the SD of the FRET value over the collection period (σFRET) plotted on the y-axis.

