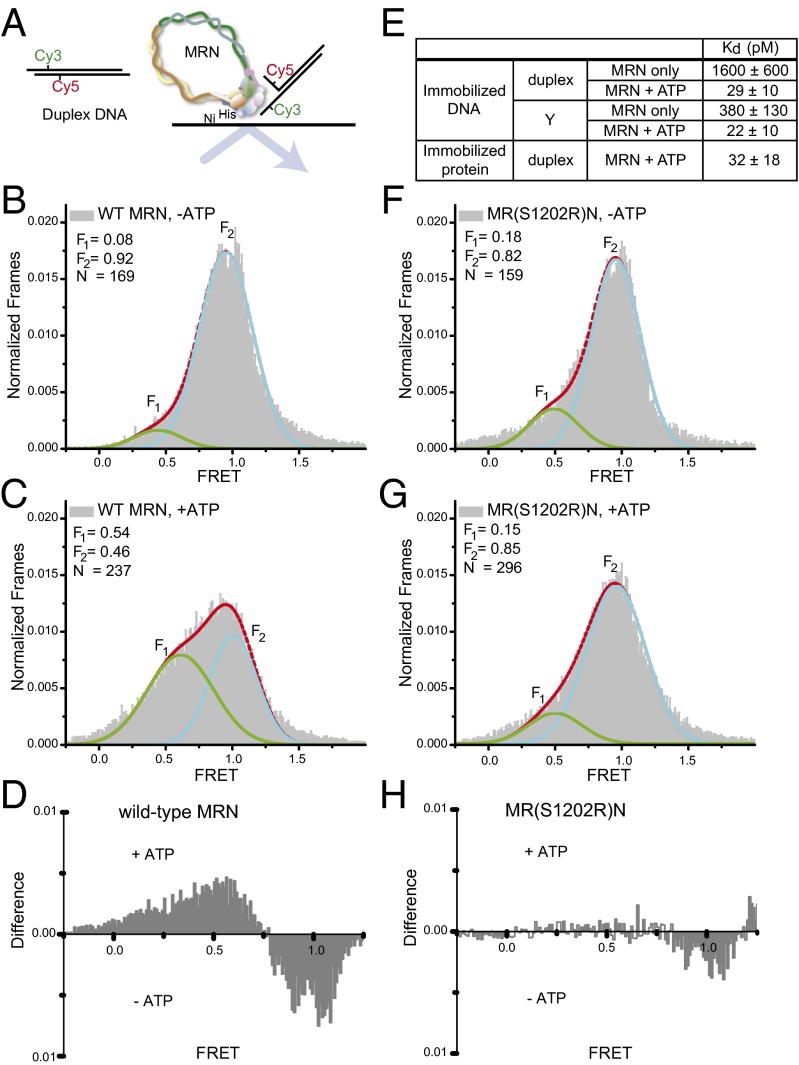
Fig. 3.
(A) Diagram of duplex DNA substrate and binding to immobilized MRN. (B and C) FRET histograms for duplex DNA bound to immobilized WT MRN in the absence (B) or presence (C) of ATP. (D) Difference plot showing the effect of ATP on FRET level for DNA bound to WT MRN. (E) Kd values for MRN–DNA binding, measured by immobilized DNA and mOrange MRN binding (Upper) or by immobilized mOrange MRN protein and duplex binding (Lower). (F and G) FRET histograms for duplex DNA bound to MR(S1202R)N in the absence (F) and presence (G) of ATP. (H) Difference plot showing the effect of ATP on FRET level for DNA bound to MR(S1202R)N.

