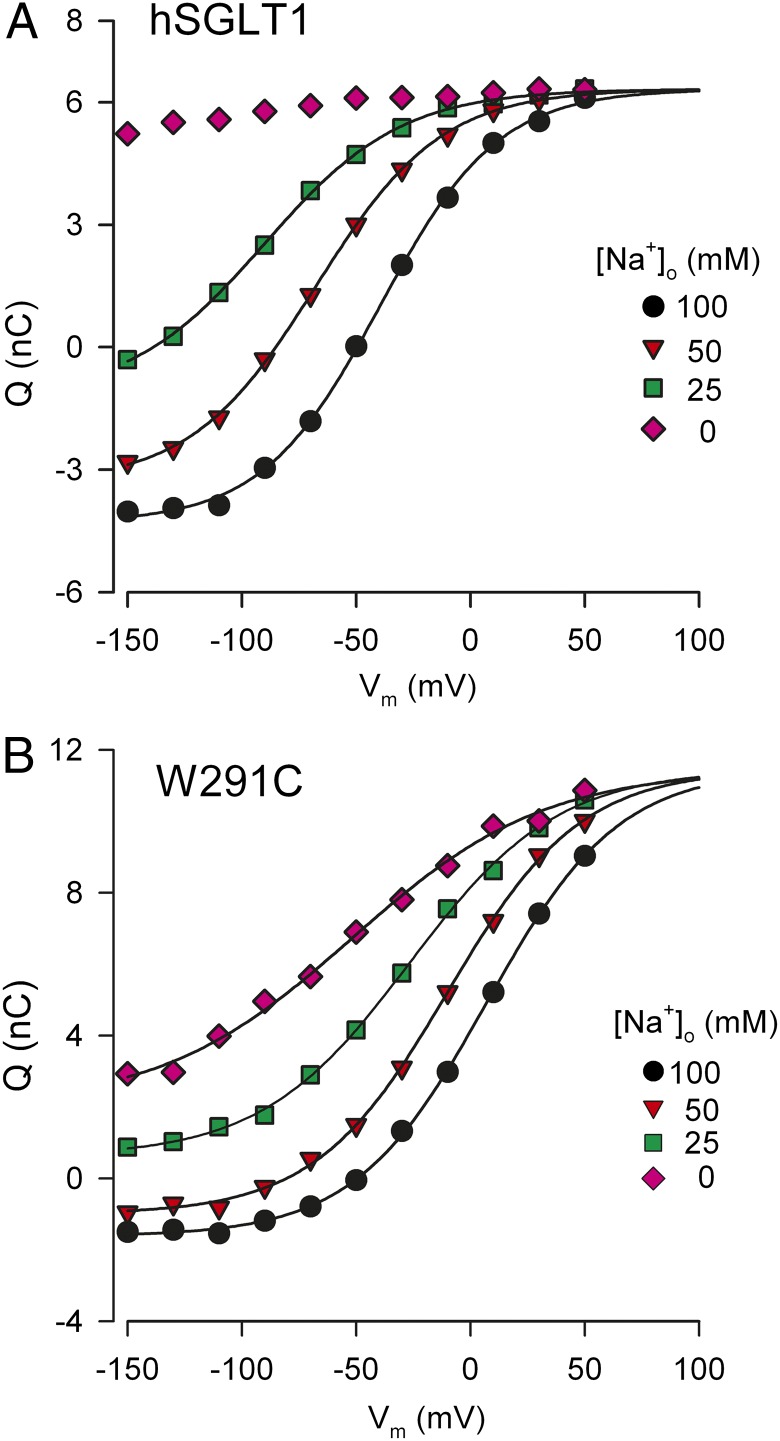
Fig. 4.
Characteristics of the charge movement for wild-type hSGLT1 and mutant W291C. The data shown are from individual oocytes. The charge vs. voltage (Q-V) relations are shown for hSGLT1 (A) and W291C (B) when [Na+]o varied from 100 mM to 0 mM. The curves were obtained by fitting the Q/V curves to the Boltzmann relation (Eq. 11) and are aligned at the depolarizing limit. Q/V data for hSGLT1 at 0 mM could not be fitted due to the extremely negative V0.5 (∼ −200 mV, Fig. 5).

