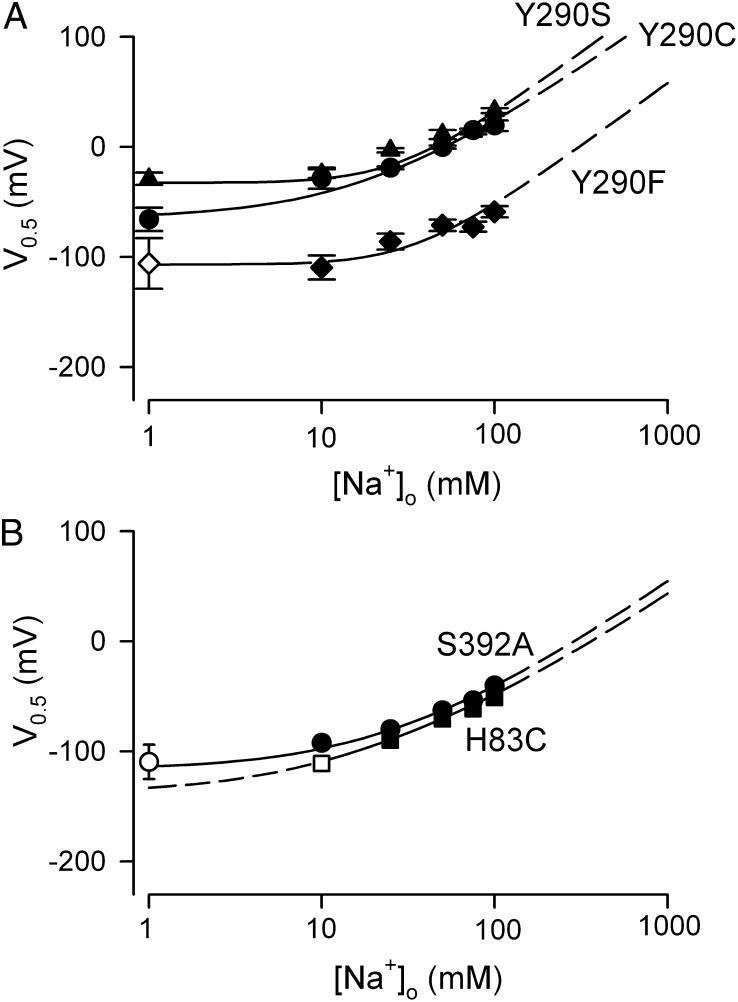
Fig. 6.
Dependence of V0.5 on [Na+]o for Y290C, Y290S and Y290F (A) and H83C and S392A (B). Data shown are from individual oocytes, with error of the fit. When V0.5 was more negative than −100 mV (for Y290F, H83C, and S392A at low [Na+]o), the open symbols were obtained from fitting the Q/V curves under the constraint that z = 0.7. The curves are from simulations of the four-state model (Eq. 9): KdA = 30 mM, KdB = 110 mM, and k16/k61 = 1 for Y290S; KdA = 30 mM, KdB = 110 mM, and k16/k61 = 2.4 for Y290C; KdA = 30 mM, KdB = 112 mM, and k16/k61 = 8 for Y290F; KdA = 30 mM, KdB = 480 mM, and k16/k61 = 15 for H83C; and KdA = 50 mM, KdB = 300 mM, and k16/k61 = 10 for S392A. z1 = 0.7, z2= 0.15, z3 = 0.15, z = 1 (z = 1 = z1 + z2 + z3), and n = 2 for all five proteins.

