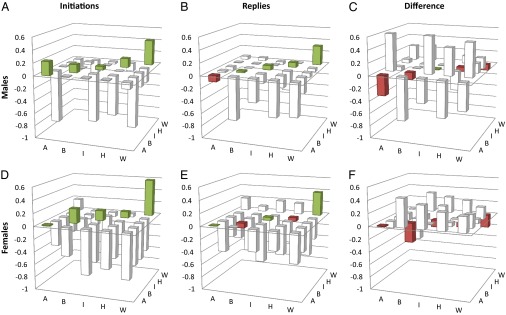
Fig. 1.

Affiliation indices representing rates of inter- and intraracial contact among site users (n = 126,134). A and D represent patterns of initiations for men and women, respectively; B and E represent patterns of responses; and C and F represent the difference between the two. The racial background of the sender (receiver) appears across the width (depth) of the plot. Colored columns emphasize in-group behavior: green signifies a positive index (preference) and red signifies a negative index (aversion). A, Asian; B, black; H, Hispanic; I, Indian; W, white.
