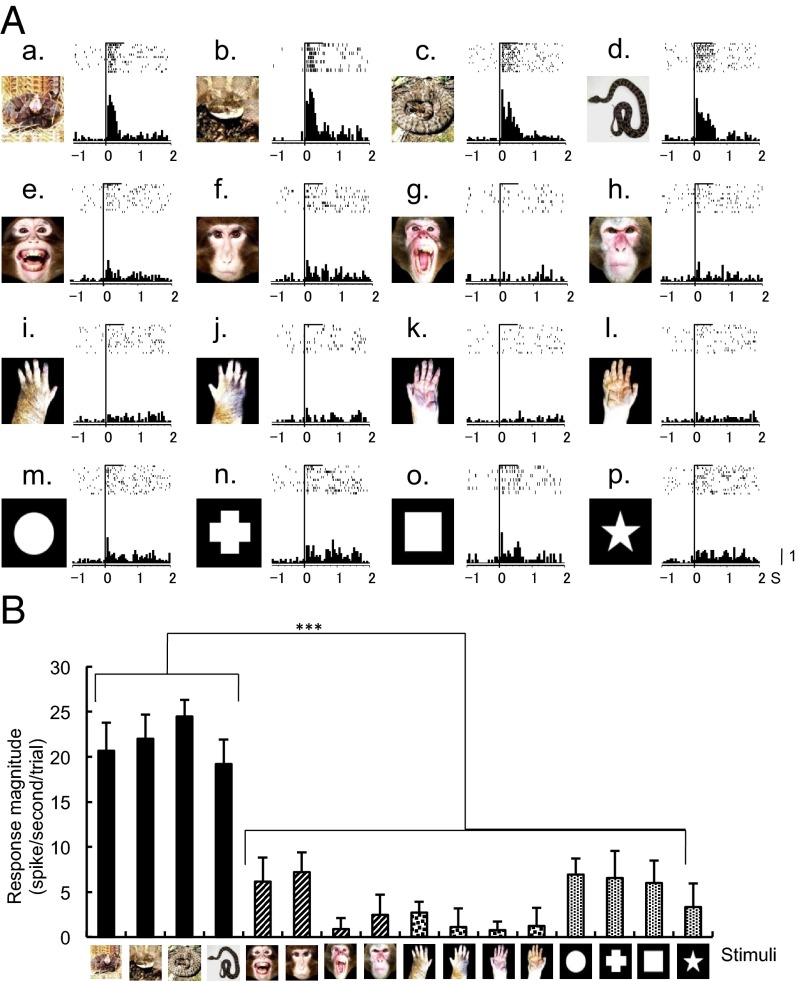
Fig. 2.
An example of a pulvinar neuron that responded most strongly to snakes. (A, a–p). Raster displays of neuronal activities and their summed histograms in response to each stimulus. (a–d) responses to snakes, (e–h) responses to monkey faces, (i–l) responses to monkey hands, and (m–p) responses to simple geometrical shapes. Horizontal bars above the raster displays indicate the stimulus presentation periods (500 ms). Vertical line in each of the raster displays and histograms indicates the stimulus onset. Calibration at the right bottom of the figure indicates the number of spikes per trial in each bin. Bin width = 50 ms. (B) Response magnitudes of the neuron shown in A to the 16 visual stimuli. The neuron responded most strongly to the snakes (***Tukey test after one-way ANOVA, P < 0.001).

